
普罗米修斯概述
Prometheus(由go语言(golang)开发)是一套开源的监控&报警&时间序列数
据库的组合。适合监控docker容器。因为kubernetes(俗称k8s)的流行带动
了prometheus的发展。
链接地址
时间序列数据
1、什么是序列数据
时间序列数据(TimeSeries Data) : 按照时间顺序记录系统、设备状态变化
的数据被称为时序数据。
应用的场景很多, 如:
无人驾驶车辆运行中要记录的经度,纬度,速度,方向,旁边物体的距
离等等。每时每刻都要将数据记录下来做分析。
某一个地区的各车辆的行驶轨迹数据
传统证券行业实时交易数据
实时运维监控数据等
2、时间序列数据特点
性能好
关系型数据库对于大规模数据的处理性能糟糕。NOSQL可以比较好的处理大规模数据,让依然比不上时间序列数据库。
存储成本低高效的压缩算法,节省存储空间,有效降低IO
Prometheus有着非常高效的时间序列数据存储方法,每个采样数据仅仅占用3.5byte左右空间,上百万条时间序列,30秒间隔,保留60天,大概花了200多G(来自官方数据)
3、Prometheus的主要特征
多维度数据模型
灵活的查询语言
不依赖分布式存储,单个服务器节点是自主的
以HTTP方式,通过pull模型拉去时间序列数据
也可以通过中间网关支持push模型
通过服务发现或者静态配置,来发现目标服务对象
支持多种多样的图表和界面展示
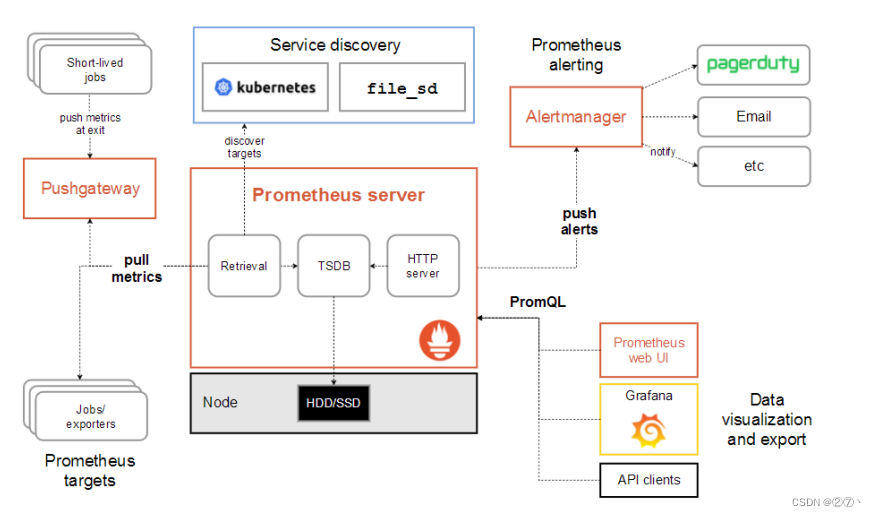
4、普罗米修斯原理架构图
安装
从 https://prometheus.io/download/ 下载相应版本,安装到服务器上
官网提供的是二进制版,解压就能用,不需要编译。
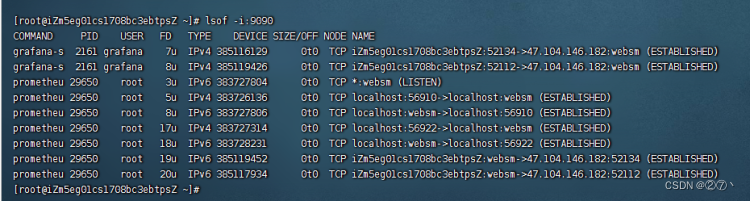
#解压,修改目录名称 tar xf prometheus-2.5.0.linux-amd64.tar.gz -C /usr/local/ mv /usr/local/prometheus-2.5.0.linux-amd64/ /usr/local/prometheus #启动 /usr/local/prometheus/prometheus --config.file="/usr/local/prometheus/prometheus.yml" & #确认端口(9090) lsof -i:9090 讯享网
prometheus界面
通过浏览器访问http://服务器IP:9090就可以访问到prometheus的主界面
监控Mysql
安装mysqld_exporter组件
下载地址: https://prometheus.io/download/
讯享网tar xf mysqld_exporter-0.11.0.linuxamd64.tar.gz -C /usr/local/ mv /usr/local/mysqld_exporter-0.11.0.linux-amd64/ /usr/local/mysqld_exporter ls /usr/local/mysqld_exporter/ #进入mysql服务,创建账号并授权 mysql -uroot -p grant select,replication client,process ON *.* to 'mysql_monitor'@'%' identified by '123'; #刷新权限 flush privileges;
配置mysqld_exporter
vim /usr/local/mysqld_exporter/.my.cnf #新增内容 [client] user=mysql_monitor password=123 启动
讯享网nohup /usr/local/mysqld_exporter/mysqld_exporter --config.my-cnf=/usr/local/mysqld_exporter/.my.cnf &
修改prometheus配置文件
vim /usr/local/prometheus/prometheus.yml #新增如下内容 - job_name: 'agent1_mariadb' # 取一个job #名称来代表被监控的mariadb static_configs: - targets: ['10.1.1.14:9104'] # 这里改成 #被监控机器的IP,后面端口接9104 修改完成后重启prometheus
讯享网/usr/local/prometheus/prometheus --config.file="/usr/local/prometheus/prometheus.yml" &
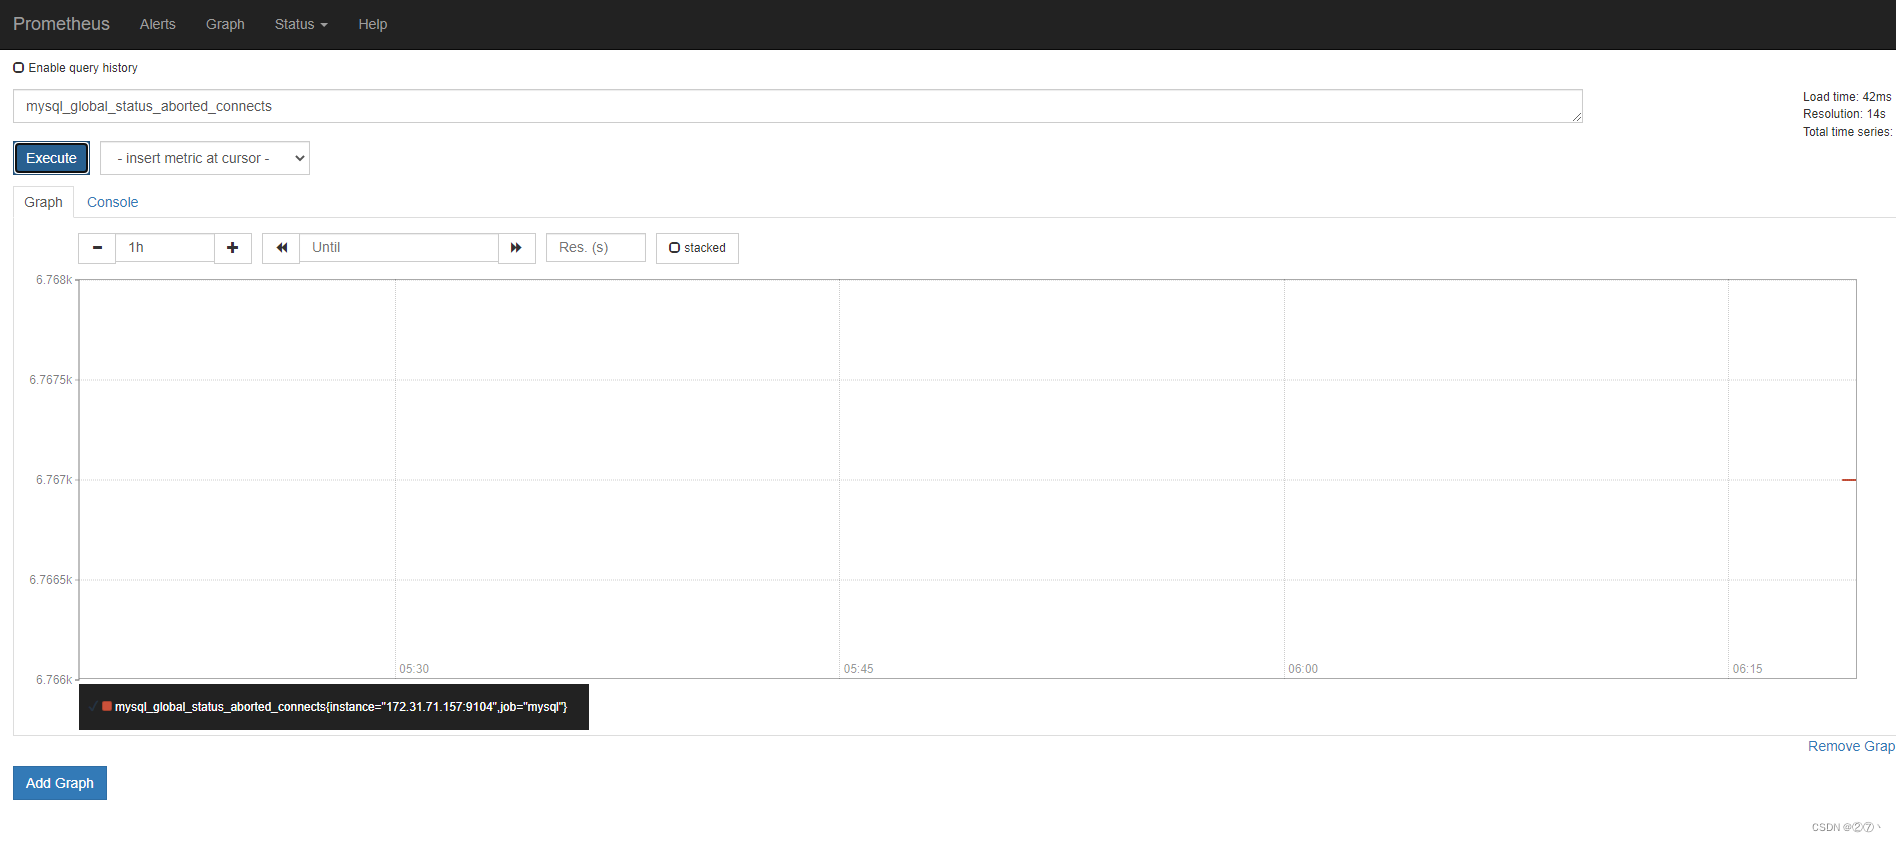
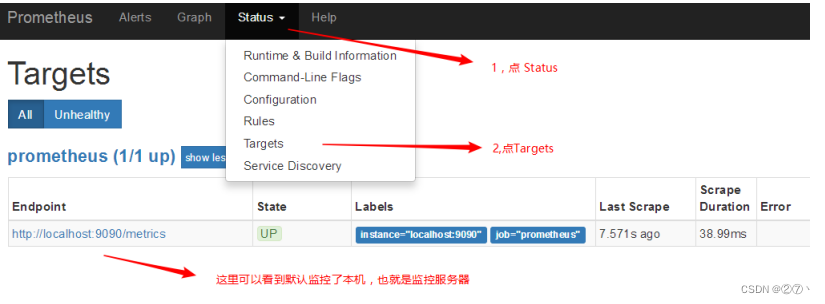
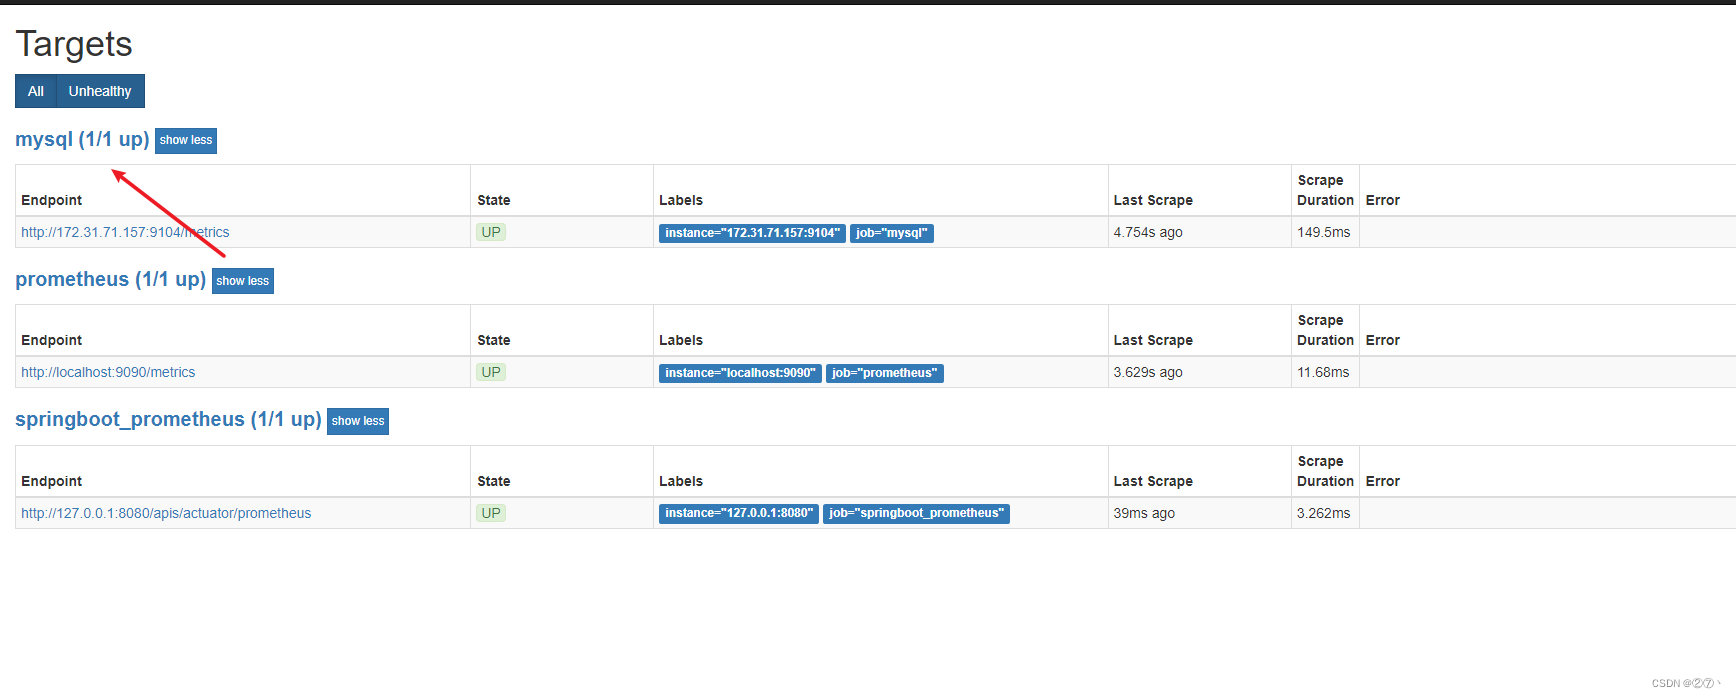
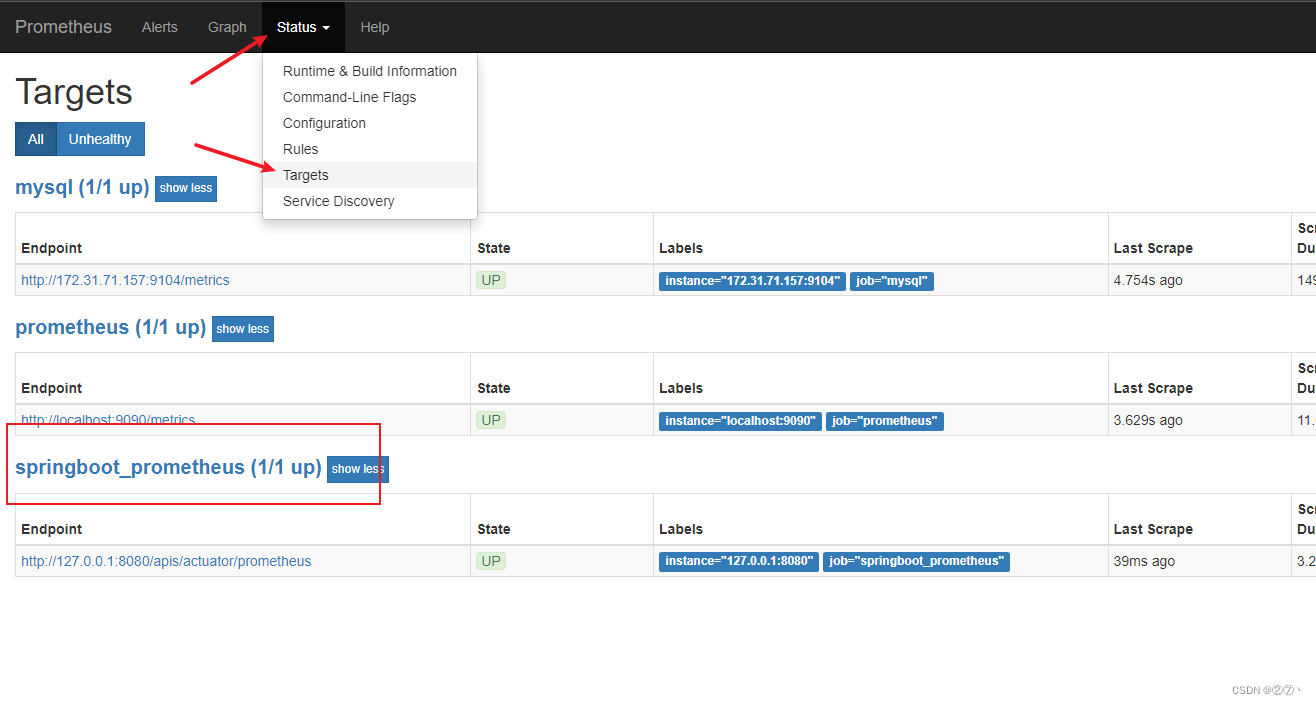
回到web管理界面 --》点Status --》点Targets --》可以看到监控
mysql了
Grafana可视化图形
安装grafana
我这里选择的rpm包,下载后直接rpm -ivh安装就OK [root@grafana ~]# rpm -ivh /root/Desktop/grafana-5.3.4- 1.x86_64.rpm 启动服务 [root@grafana ~]# systemctl start grafana-server [root@grafana ~]# systemctl enable grafana-server 确认端口(3000) [root@grafana ~]# lsof -i:3000 通过浏览器访问 http:// grafana服务器IP:3000就到了登录界面,使用默认的admin用户,admin密码就可以登陆了


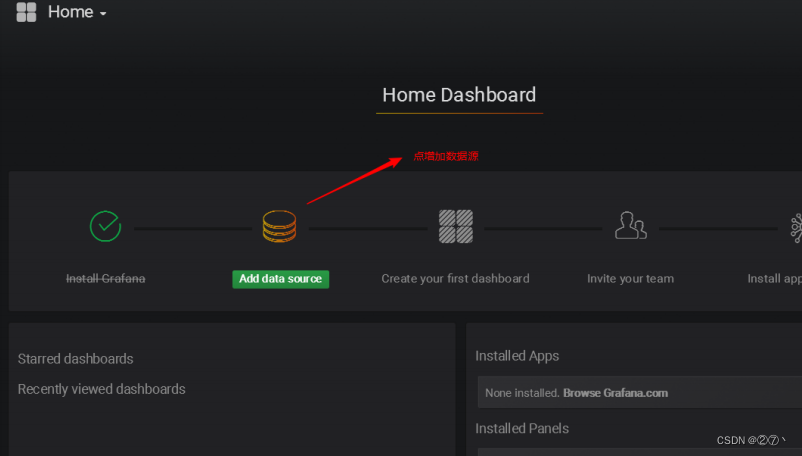
下面我们把prometheus服务器收集的数据做为一个数据源添加到grafana,让grafana可以得到prometheus的数据。
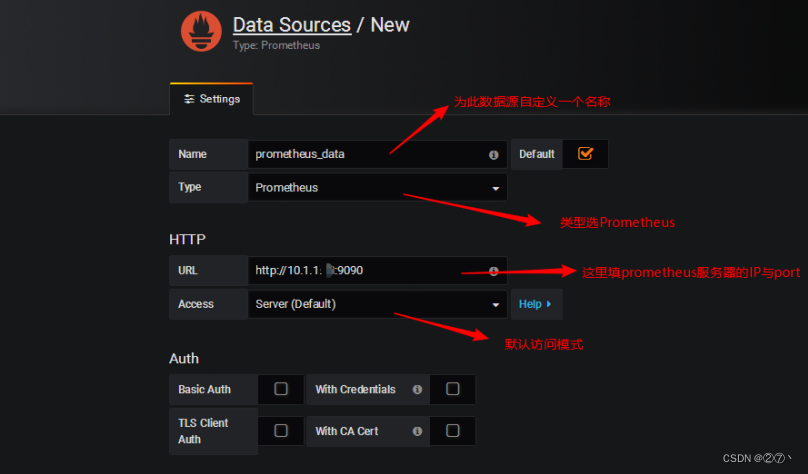
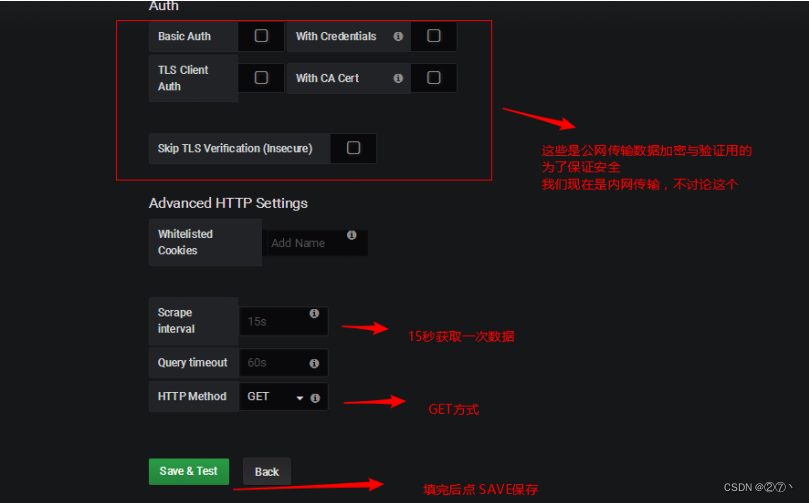
创建数据源
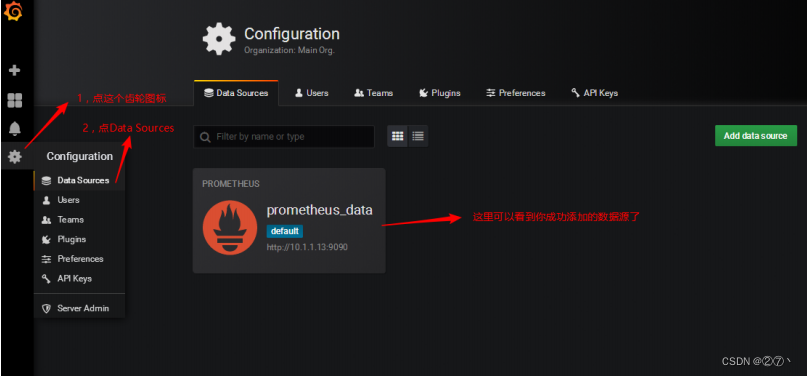
然后为添加好的数据源做图形显示
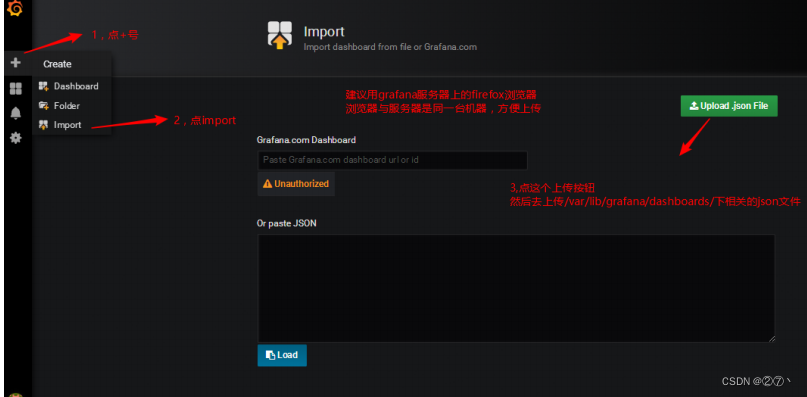
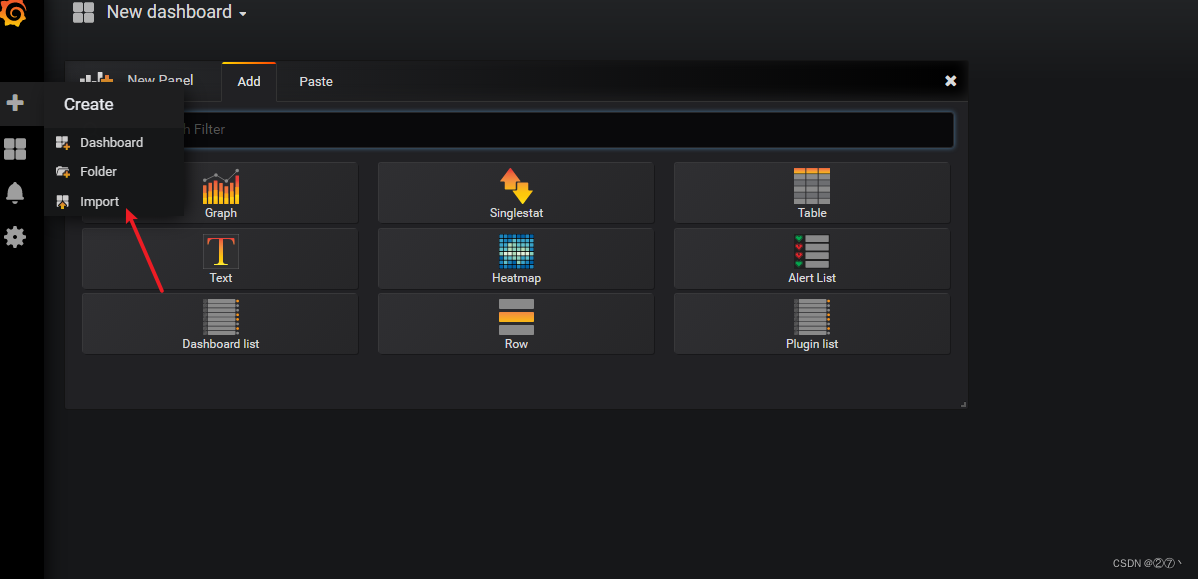
导入json文件
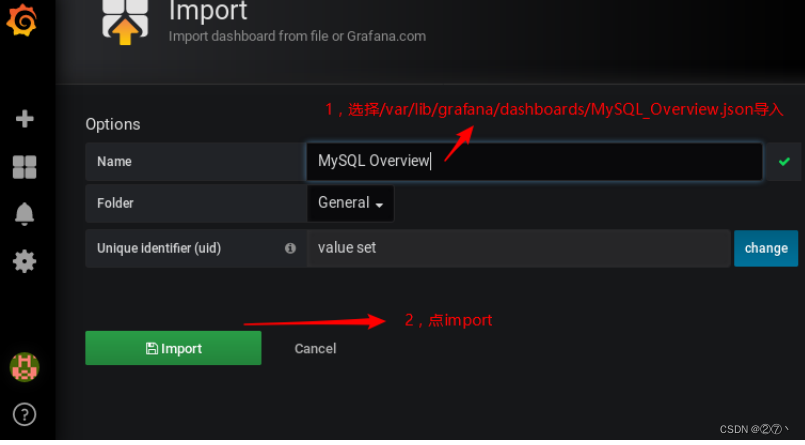
点import导入后,报prometheus数据源找不到,因为这些json文件里默认要找的就是叫Prometheus的数据源,但我们前面建立的数据源却是叫prometheus_data(坑啊)
那么请自行把原来的prometheus_data源改名为Prometheus即可(注意: 第一个字母P是大写)
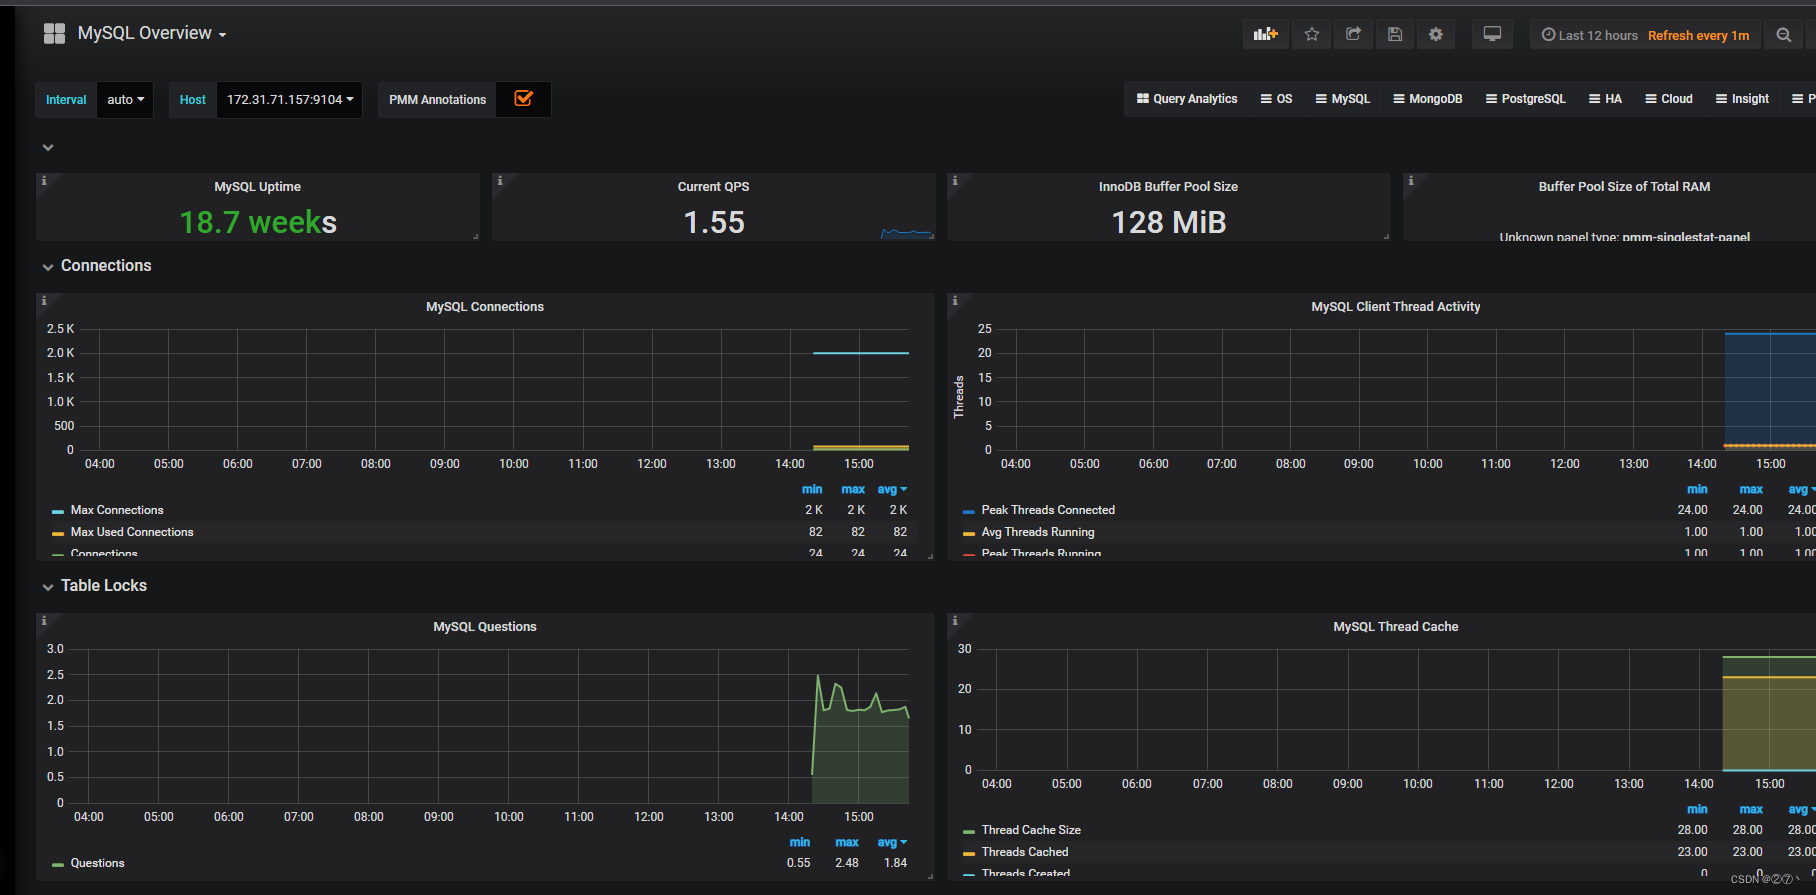
然后再回去刷新,就有数据了(如下图所示)
监控SpringBoot
添加依赖
讯享网 <dependency> <groupId>org.springframework.boot</groupId> <artifactId>spring-boot-starter-actuator</artifactId> </dependency> <dependency> <groupId>io.micrometer</groupId> <artifactId>micrometer-registry-prometheus</artifactId> <version>1.1.3</version> </dependency>
修改配置文件
配置文件中加入配置,这里就只进行一些简单配置,management.metrics.tags.application属性是本文配合Grafana的Dashboard设置的,如下所示:
spring.application.name=springboot_prometheus management.endpoints.web.exposure.include=* management.metrics.tags.application=${spring.application.name} 设置application
讯享网@SpringBootApplication public class Springboot2PrometheusApplication {
    public static void main(String[] args) {
    SpringApplication.run(Springboot2PrometheusApplication.class, args); } @Bean MeterRegistryCustomizer<MeterRegistry> configurer( @Value("${spring.application.name}") String applicationName) {
    return (registry) -> registry.config().commonTags("application", applicationName); } }
SpringBoot项目到这里就配置完成了,启动项目,访问http://localhost:8080/actuator/prometheus,如图所示,可以看到一些度量指标。
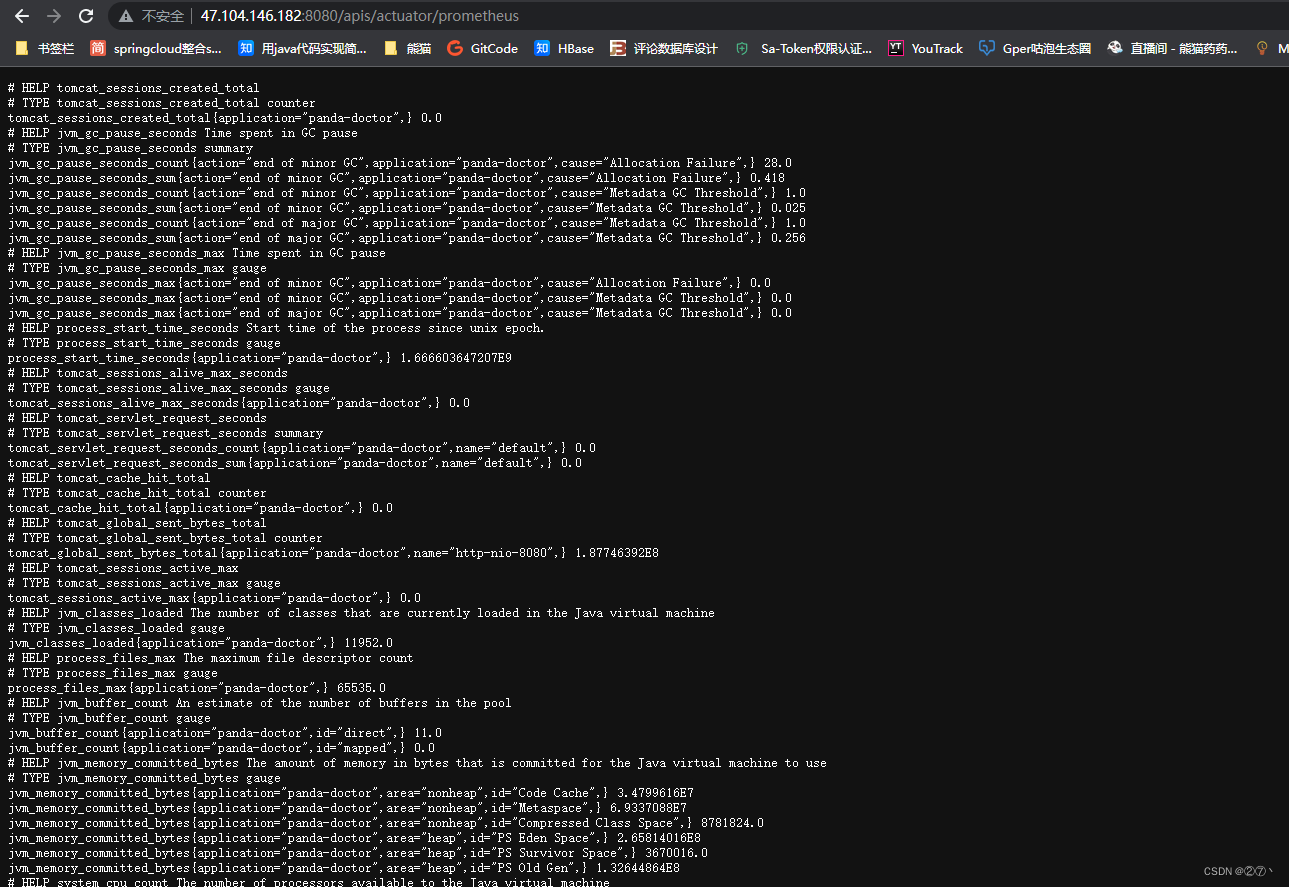
Prometheus配置
配置应用
在prometheus配置监控我们的SpringBoot应用,完整配置如下所示。
# my global config global: scrape_interval: 15s # Set the scrape interval to every 15 seconds. Default is every 1 minute. evaluation_interval: 15s # Evaluate rules every 15 seconds. The default is every 1 minute. # scrape_timeout is set to the global default (10s). # Alertmanager configuration alerting: alertmanagers: - static_configs: - targets: # - alertmanager:9093 # Load rules once and periodically evaluate them according to the global 'evaluation_interval'. rule_files: # - "first_rules.yml" # - "second_rules.yml" # A scrape configuration containing exactly one endpoint to scrape: # Here it's Prometheus itself. scrape_configs: - job_name: 'prometheus' static_configs: - targets: ['127.0.0.1:9090'] 以下内容为SpringBoot应用配置 - job_name: 'springboot_prometheus' scrape_interval: 5s metrics_path: '/actuator/prometheus' static_configs: - targets: ['127.0.0.1:8080'] 复制代码 启动Prometheus
启动Prometheus,浏览器访问,查看Prometheus页面,如图所示。
Grafana配置
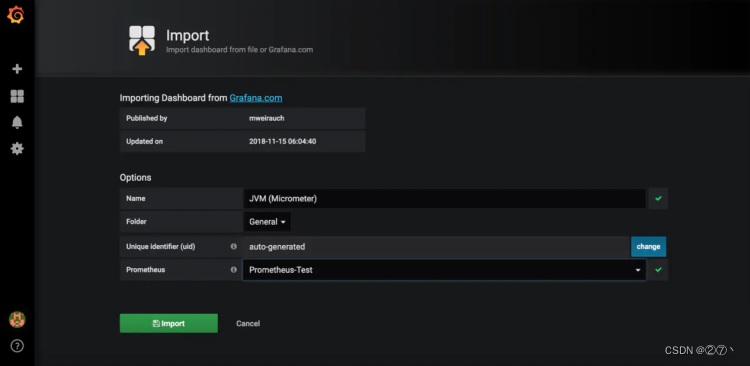
在Grafana内点击如图所示import按钮.前提是Grafana已经创建好数据源了
在如图所示位置填写4701,然后点击load。
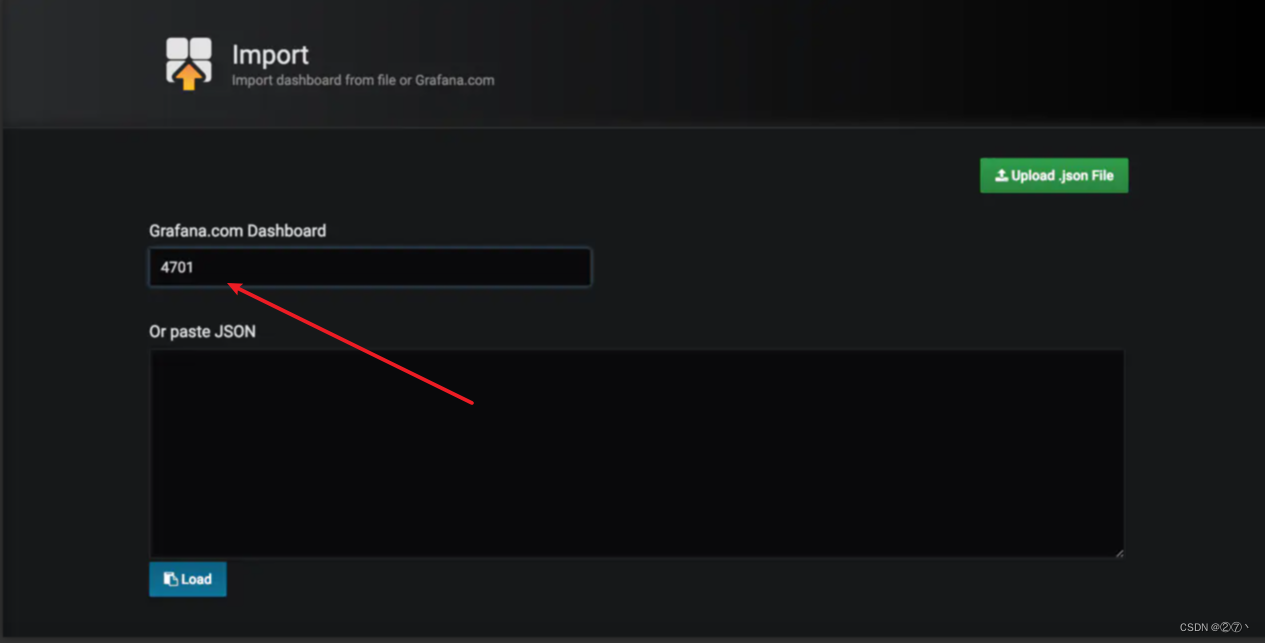
导入Doshboard。
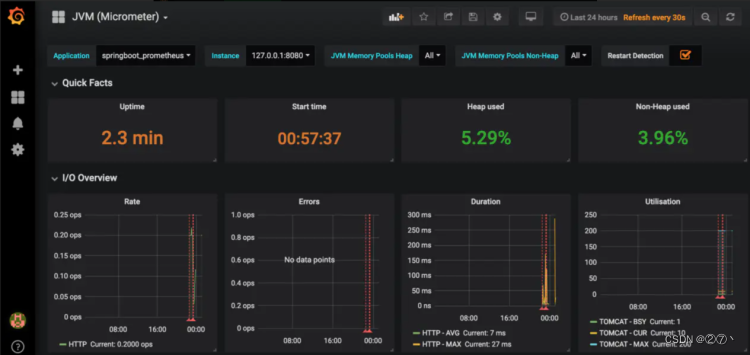
导入后就可以看到我们的SpringBoot项目对应的指标图表了,如图。
版权声明:本文内容由互联网用户自发贡献,该文观点仅代表作者本人。本站仅提供信息存储空间服务,不拥有所有权,不承担相关法律责任。如发现本站有涉嫌侵权/违法违规的内容,请联系我们,一经查实,本站将立刻删除。
如需转载请保留出处:https://51itzy.com/kjqy/14633.html