
转载自:MATLAB画图使用不同的线型、点及标记 (baidu.com)
一、 线型、连续标记
先从最普通的说起。在plot函数中指定线型。
t=linspace(0,5,20);
x1 = t;
x2 = 2*t;
x3 = 3*t;
x4 = 4*t;
plot(t,x1,'b',t,x2,'g-o',t,x3,'r*',t,x4,'c:d');
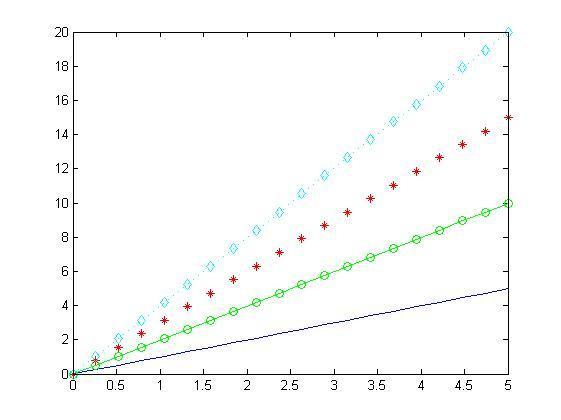
这是基础的比较简单的情况。不做太多叙述。matlab提供的线型、颜色和标记符如下表:
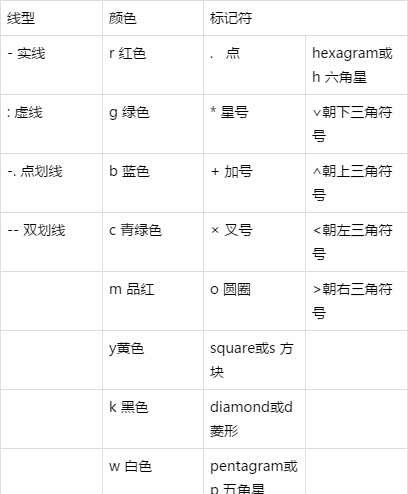
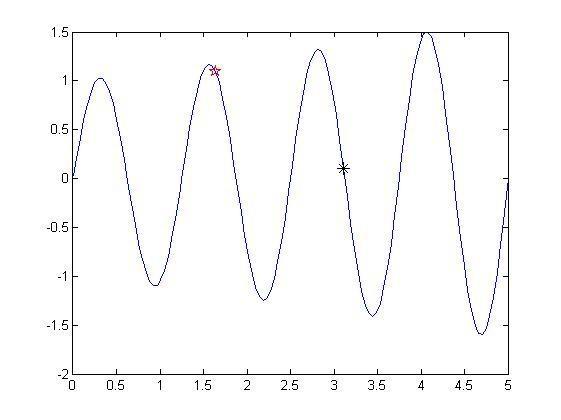
如果指定了标记符号但未指定线型,则 plot 仅显示无线条连接的标记。
A = 1;
f= 1;
x1 = A * sin(2*pi*f*t)./t;
x2 = A * cos(2*pi*f*t-pi/2)./t;
plot(t,x1,'bo',t,x2,'r*');
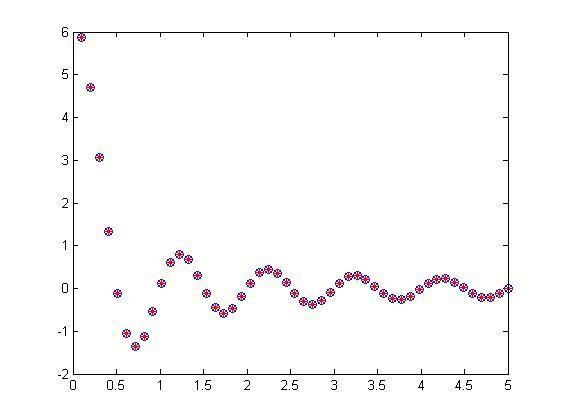
两组数据比较
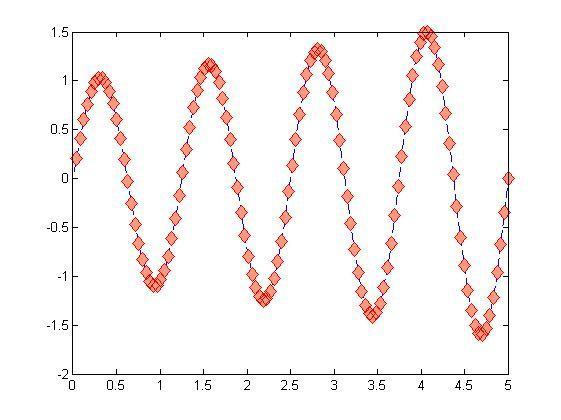
可以通过名称-值对组参数来设置标记属性,自定义标记。
MarkerSize- 标记大小,指定为正值。MarkerEdgeColor- 标记轮廓颜色,指定为颜色名称或 RGB 三元组。MarkerFaceColor- 标记内部颜色,指定为颜色名称或 RGB 三元组。t=linspace(0,5,120);
A = 1;
f= 0.2;
x1 = exp(t/10).*sin(4*2*pi*f*t);
plot(t,x1,'b--d','MarkerSize',9, 'MarkerEdgeColor','red', 'MarkerFaceColor',[1 0.6 0.5])
二、在指定位置做标记
如果需要在特定的点做标记,可以使用MarkerIndices(要显示标记的数据点的索引)设置。
1、比如从第一个数据点开始,每隔十个数据点显示一个标记。则可设置plot(x,y,'-*','MarkerIndices',1:10:length(y))。
2、假如在最小数据值和最大数据值处显示红色标记。首先找到最大最小值。
idxmin = find(y == max(y));
idxmax = find(y == min(y));
然后设置 plot(x,y,'-d','MarkerIndices',[idxmin idxmax]).
同理,我们可以使用MarkerIndices属性设置需要做标记的指定位置。
plot(x,y,'-d','MarkerIndices',[1 10 18 32]).
注意:MarkerIndices是MATLAB R2016b及之后版本才有的。
3、plot函数中直接指定横竖坐标
t=linspace(0,5,120);

A = 1;
f= 0.2;
x1 = exp(t/10).*sin(4*2*pi*f*t);
plot(t,x1,t(40),x1(40),'rp',t(75),x1(75),'k*');
4、text添加文字说明
t=linspace(0,5,100);
A = 1;
f= 1;
x1 = A * sin(2*pi*f*t)./t;
plot(t,x1,'b-.',t(6),x1(6),'rp',t(60),x1(60),'md');
text(t(6),x1(6),[ ' \leftarrow' 'P(' num2str(t(6)) ',' num2str(x1(6)) ')' ]);
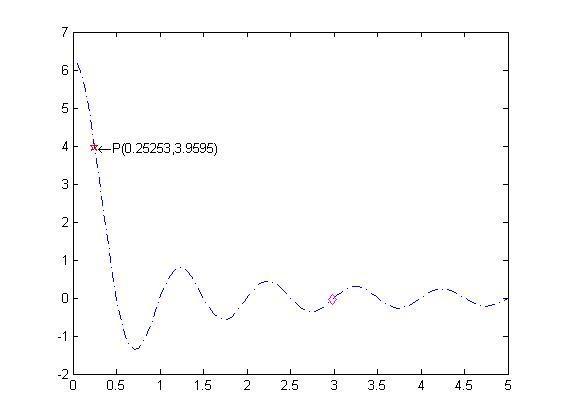
还可以设置说明颜色。
text(t(6),x1(6),[ ' \leftarrow' 'P(' num2str(t(6)) ',' num2str(x1(6)) ')' ],'color','r');
还可以使用gtext,gtext('输入内容'),然后在图片上点击鼠标确定标记位置。
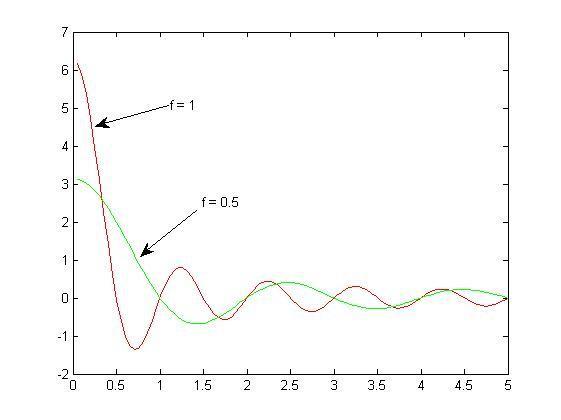
5、annotation()函数
annotation(lineType,x,y) 创建一个在当前图窗中的两个点之间延伸的线条或箭头注释。将 lineType 指定为 'line'、'arrow'、'doublearrow' 或 'textarrow'。将 x 和 y 分别指定为 [x_begin x_end] 和 [y_begin y_end] 形式的二元素向量。
比如 annotation('textarrow',x,y) % 坐标x,y是标准化的坐标,其取值在 0~1之间,整个figure窗口左下角为(0, 0),右上角为(1, 1)。
close all;
t=linspace(0,5,100);
A = 1;
f= 1;
x1 = A * sin(2*pi*f*t)./t;
x2= A * sin(2*pi*0.5*t)./t;
plot(t,x1,'r',t,x2,'g');
a = [0.3 0.17];
b = [0.75 0.7];
annotation('textarrow',a,b,'String','f = 1 ');
annotation('textarrow',[0.35 0.25],[0.5 0.39],'String',' f = 0.5 ');
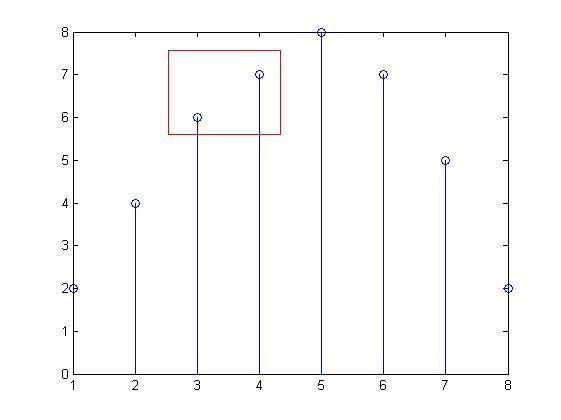
annotation
设置图窗添加矩形注释。annotation('rectangle',[x y w h])% 建立矩形注释对象。
figure
data = [2 4 6 7 8 7 5 2];
stem(data)
dim = [.3 .68 .2 .2];
annotation('rectangle',dim,'Color','red')
版权声明:本文内容由互联网用户自发贡献,该文观点仅代表作者本人。本站仅提供信息存储空间服务,不拥有所有权,不承担相关法律责任。如发现本站有涉嫌侵权/违法违规的内容,请联系我们,一经查实,本站将立刻删除。
如需转载请保留出处:https://51itzy.com/kjqy/66422.html