
目录
一、Graphics 图形界面
二、Enabling Graphics 启用图形界面功能
2.1、Compiling with Graphics Support 编译时启用图形界面支持
2.2、Enabling Graphics at Run-time在运行时启用图形界面功能
3.1、Visualizing Placement 可视化布局
3.2、Visualizing Netlist Connectivity 可视化网表连接
3.3、Visualizing the Critical Path 可视化关键路径
3.4、Visualizing Routing Architecture 可视化路由架构
3.5、Visualizing Routing Congestion 可视化路由拥塞
3.6、Visualizing Routing Utilization 可视化路由利用情况
3.7、Toggle Block Internal 切换块内部
四、Button Description Table 按钮功能描述
五、Manual Moves 手动移动
【本文主要是对vpr开源工具官方文档的部分翻译,有不正确或不准确的地方,还请多多指出。】
一、Graphics 图形界面
VPR includes easy-to-use graphics for visualizing both the targetted FPGA architecture, and the circuit VPR has implementation on the architecture.
VPR包含易于使用的图形功能,可以可视化目标FPGA架构以及VPR在该架构上实现的电路。
二、Enabling Graphics 启用图形界面功能
2.1、Compiling with Graphics Support 编译时启用图形界面支持
The build system will attempt to build VPR with graphics support by default. 默认情况下,构建系统将尝试使用图形支持构建VPR。
If all the required libraries are found the build system will report: 如果找到了所有所需的库,构建系统将会报告以下内容:
-- EZGL: graphics enabled
If the required libraries are not found cmake will report: 如果没有找到所需的库,CMake 将会报告:
-- EZGL: graphics disabled
and list the missing libraries: 并列出缺失的库:
-- EZGL: Failed to find required X11 library (on debian/ubuntu try 'sudo apt-get install libx11-dev' to install)
-- EZGL: Failed to find required Xft library (on debian/ubuntu try 'sudo apt-get install libxft-dev' to install)
-- EZGL: Failed to find required fontconfig library (on debian/ubuntu try 'sudo apt-get install fontconfig' to install)
-- EZGL: Failed to find required cairo library (on debian/ubuntu try 'sudo apt-get install libcairo2-dev' to install)
2.2、Enabling Graphics at Run-time在运行时启用图形界面功能
When running VPR provide vpr --disp on to enable graphics.
在运行 VPR 时,使用命令 "vpr --disp on" 来启用图形功能。
Saving Graphics at Run-time 在运行时保存图形
When running VPR provide vpr --save_graphics on to enable graphics.
在运行 VPR 时,使用命令 "vpr --save_graphics on" 来启用图形保存功能。
A graphical window will now pop up when you run VPR.
现在运行 VPR 时将会弹出一个图形窗口。
三、Navigation导航
Click on Zoom-Fit buttons to zoom the view. Click and drag with the left mouse button to pan the view, or scroll the mouse wheel to zoom in and out. Click on the Window, then on the diagonally opposite corners of a box, to zoom in on a particular area.
点击"Zoom-Fit"按钮可以缩放视图。使用鼠标左键点击并拖动可以平移视图,或者滚动鼠标滚轮可以进行放大和缩小。点击"Window",然后点击对角线相反的两个角,可以对特定区域进行放大。
Click on Save to save the image on screen to PDF, PNG, or SVG file.
点击"保存"可以将屏幕上的图像保存为PDF、PNG或SVG文件。
Proceed tells VPR to continue with the next step in placing and routing the circuit.
"Proceed"告诉VPR继续进行电路的布局和布线的下一步。
Note:
Menu buttons will be greyed out when they are not selectable (e.g. VPR is working).
当菜单按钮不可选择时(例如,VPR正在运行),它们将变为灰色,无法点击。
3.1、Visualizing Placement 可视化布局
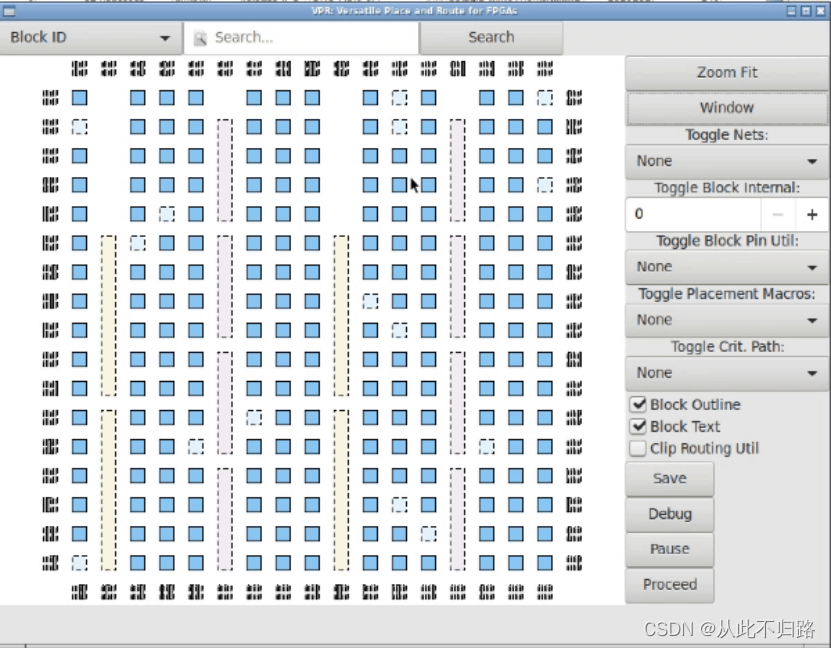
By default VPR’s graphics displays the FPGA floorplan (block grid) and current placement.
默认情况下,VPR的图形显示了FPGA的楼层平面图(块网格)和当前的布局。
If the Placement Macros drop down is set, any placement macros (e.g. carry chains, which require specific relative placements between some blocks) will be highlighted.
如果设置了"Placement Macros"下拉菜单,任何布局宏(例如,Carry链,它们需要一些块之间的特定相对位置)将会被突出显示。
3.2、Visualizing Netlist Connectivity 可视化网表连接
The Toggle Nets drop-down list toggles the nets in the circuit visible/invisible.
"Toggle Nets"下拉列表可以切换电路中的网络(nets)的可见性,使其在显示和隐藏之间切换。
When a placement is being displayed, routing information is not yet known so nets are simply drawn as a “star;” that is, a straight line is drawn from the net source to each of its sinks. Click on any clb in the display, and it will be highlighted in green, while its fanin and fanout are highlighted in blue and red, respectively. Once a circuit has been routed the true path of each net will be shown.
在显示布局时,尚未获得布线信息,因此网络(nets)将简单地以“星形”绘制,即从网络源到每个接收器绘制一条直线。单击显示中的任何CLB(Configurable Logic Block),它将以绿色突出显示,而其输入和输出将分别以蓝色和红色突出显示。一旦电路完成布线,将显示每个网络的真实路径。
If the nets routing are shown, click on a clb or pad to highlight its fanins and fanouts, or click on a pin or channel wire to highlight a whole net in magenta. Multiple nets can be highlighted by pressing ctrl + mouse click.
如果显示了网络的布线,点击CLB(Configurable Logic Block)或Pad以突出显示其Fan-in(输入)和Fan-out(输出),或者点击Pin(引脚)或通道线(channel wire)以以品红色突出显示整个网络。按住Ctrl键并鼠标点击可以同时突出显示多个网络。
3.3、Visualizing the Critical Path 可视化关键路径
During placement and routing you can click on the Crit. Path drop-down menu to visualize the critical path. Each stage between primitive pins is shown in a different colour. Cliking the Crit. Path button again will toggle through the various visualizations: * During placement the critical path is shown only as flylines. * During routing the critical path can be shown as both flylines and routed net connections.
在进行布局和布线过程中,您可以单击“Crit. Path”下拉菜单来可视化关键路径。每个原语引脚之间的每个阶段以不同的颜色显示。再次单击“Crit. Path”按钮将切换不同的可视化方式:
- 在布局过程中,关键路径仅以飞线(flylines)的形式显示。
- 在布线过程中,关键路径可以同时以飞线和已布线的网络连接的形式显示。
这种可视化方法可以帮助您在布局和布线期间更好地理解关键路径,并进行电路性能的分析和优化。
3.4、Visualizing Routing Architecture 可视化路由架构
When a routing is on-screen, clicking on Toggle RR lets you to choose between various views of the routing resources available in the FPGA.
通过点击"Toggle RR"按钮,您可以选择不同的路由资源视图,以了解FPGA中可用的路由资源的布局和连接情况。这些视图可能包括通道、线缆、交叉点等不同的路由资源元素及其相互之间的关系。通过切换不同的视图,您可以更好地了解FPGA的路由架构,以及电路在FPGA上的布线情况。
The routing resource view can be very useful in ensuring that you have correctly described your FPGA in the architecture description file – if you see switches where they shouldn’t be or pins on the wrong side of a clb, your architecture description needs to be revised.
通过检查路由资源视图,您可以验证您的FPGA架构描述文件是否正确描述了FPGA的布局和连接规则。如果在视图中发现不符合预期的元素位置或连接关系,这可能意味着您的架构描述存在错误或不一致之处。在这种情况下,您需要重新审查和修正架构描述文件,以确保其与实际的FPGA架构相匹配。这将有助于确保电路在FPGA上正确布线和工作。
Wiring segments are drawn in black, input pins are drawn in sky blue, and output pins are drawn in pink. Sinks are drawn in dark slate blue, and sources in plum. Direct connections between output and input pins are shown in medium purple. Connections from wiring segments to input pins are shown in sky blue, connections from output pins to wiring segments are shown in pink, and connections between wiring segments are shown in green. The points at which wiring segments connect to clb pins (connection box switches) are marked with an x.
在可视化中,绘制的布线段使用黑色,输入引脚使用天蓝色,输出引脚使用粉红色。接收器(sinks)使用深灰蓝色绘制,发送器(sources)使用梅红色绘制。输出引脚与输入引脚之间的直接连接以中等紫色显示。从布线段到输入引脚的连接以天蓝色显示,从输出引脚到布线段的连接以粉红色显示,布线段之间的连接以绿色显示。布线段连接到CLB引脚的点(连接盒开关)用"X"标记。
Switch box connections will have buffers (triangles) or pass transistors (circles) drawn on top of them, depending on the type of switch each connection uses. Clicking on a clb or pad will overlay the routing of all nets connected to that block on top of the drawing of the FPGA routing resources, and will label each of the pins on that block with its pin number. Clicking on a routing resource will highlight it in magenta, and its fanouts will be highlighted in red and fanins in blue. Multiple routing resources can be highlighted by pressing ctrl + mouse click.
开关盒连接将根据每个连接使用的开关类型,在其上方绘制缓冲器(三角形)或传导管(圆圈)。单击CLB或Pad将在FPGA路由资源的绘图上叠加显示连接到该块的所有网络的布线,并使用引脚编号为该块上的每个引脚进行标记。单击路由资源将以品红色突出显示它,并且它的Fan-out将以红色突出显示,Fan-in将以蓝色突出显示。通过按住Ctrl键并鼠标点击可以同时突出显示多个路由资源。
3.5、Visualizing Routing Congestion 可视化路由拥塞
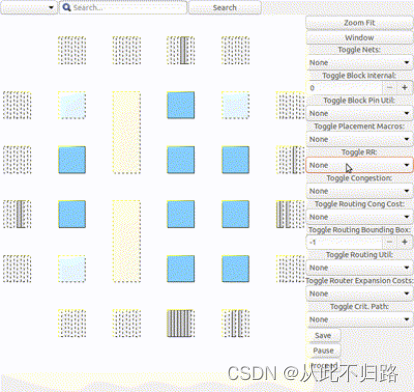
When a routing is shown on-screen, clicking on the Congestion drop-down menu will show a heat map of any overused routing resources (wires or pins). Lighter colours (e.g. yellow) correspond to highly overused resources, while darker colours (e.g. blue) correspond to lower overuse. The overuse range shown at the bottom of the window.
当屏幕上显示一条路由时,点击“拥堵”下拉菜单将显示使用过多的路由资源(电线或引脚)的热力图。较浅的颜色(如黄色)表示高度过度使用的资源,而较深的颜色(如蓝色)表示较低的过度使用。窗口底部显示了过度使用的范围。
3.6、Visualizing Routing Utilization 可视化路由利用情况
When a routing is shown on-screen, clicking on the Routing Util drop-down menu will show a heat map of routing wire utilization (i.e. fraction of wires used in each channel). Lighter colours (e.g. yellow) correspond to highly utilized channels, while darker colours (e.g. blue) correspond to lower utilization.
当屏幕上显示一条路由时,点击“路由利用率”下拉菜单将显示路由电线利用情况的热力图(即每个通道中使用的电线比例)。较浅的颜色(例如黄色)表示利用率高的通道,而较深的颜色(例如蓝色)表示利用率较低。
3.7、Toggle Block Internal 切换块内部
During placement and routing you can adjust the level of block detail you visualize by using the Toggle Block Internal. Each block can contain a number of flip flops (ff), look up tables (lut), and other primitives. The higher the number, the deeper into the hierarchy within the cluster level block you see.
在布局和布线过程中,您可以通过使用“切换块内部”来调整您可视化的块详细级别。每个块可以包含多个触发器(flip flop)、查找表(look up table)和其他基元。数字越高,您可以看到更深层次的集群级块内部层次结构。
四、Button Description Table 按钮功能描述
| Buttons |
Stages 阶段
|
Functionalities功能 |
Detailed Descriptions详细描述 |
| Blk Internal |
Placement/ Routing |
Controls depth of sub-blocks shown控制显示的子块深度 |
Click multiple times to show more details; Click to reset when reached maximum level of detail 点击多次以显示更多细节;当达到最大细节级别时,点击以重置 |
| Toggle Block Internal |
Placement/ Routing |
Adjusts the level of visualized block detail调整可视化块详细级别 |
Click multiple times to go deeper into the hierarchy within the cluster level block点击多次以深入进入集群级块内部的层次结构 |
| Blk Pin Util |
Placement/ Routing |
Visualizes block pin utilization 可视化块引脚利用情况 |
Click multiple times to visualize all block pin utilization, input block pin utilization, or output block pin utilization 点击多次以可视化所有块引脚利用情况、输入块引脚利用情况或输出块引脚利用情况 |
| Cong. Cost |
Routing |
Visualizes the congestion costs of routing resouces可视化路由资源的拥堵成本 |
|
| Congestion |
Routing |
Visualizes a heat map of overused routing resources可视化过度使用的路由资源的热力图 |
|
| Crit. Path |
Placement/ Routing |
Visualizes the critical path of the circuit可视化电路的关键路径 |
|
| Draw Partitions |
Placement/ Routing |
Visualizes placement constraints可视化布局约束 |
|
| Place Macros |
Placement/ Routing |
Visualizes placement macros 可视化布局宏(placement macros) |
|
| Route BB |
Routing |
Visualizes net bounding boxes one by one 逐个可视化网(net)的边界框(bounding boxes) |
Click multiple times to sequence through the net being shown点击多次以依次显示不同的网(net) |
| Router Cost |
Routing |
Visualizes the router costs of different routing resources 可视化不同路由资源的路由器成本 |
|
| Routing Util |
Routing |
Visualizes routing channel utilization with colors indicating the fraction of wires used within a channel通过使用颜色来表示通道内使用的电线比例,可视化路由通道利用情况。 |
|
| Toggle Nets |
Placement/ Routing |
Visualizes the nets in the circuit 可视化电路中的网(nets)。 |
Click multiple times to set the nets to be visible / invisible 点击多次以设置网的可见性/不可见性。 |
| Toggle RR |
Placement/ Routing |
Visualizes different views of the routing resources 可视化路由资源的不同视图。 |
Click multiple times to switch between routing resources available in the FPGA点击多次以在可用的FPGA中切换路由资源。 |

五、Manual Moves 手动移动
The manual moves feature allows the user to specify the next move in placement. If the move is legal, blocks are swapped and the new move is shown on the architecture.
手动移动功能允许用户指定布局中的下一步移动。如果移动是合法的,块将被交换,并且新的移动将显示在架构上。
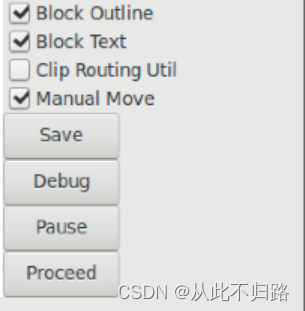
To enable the feature, activate the Manual Move toggle button and press Proceed. Alternatively, the user can active the Manual Move toggle button and click on the block to be moved.
要启用该功能,请激活“手动移动”切换按钮并按下“进行”按钮。或者,用户可以激活“手动移动”切换按钮,然后点击要移动的块。
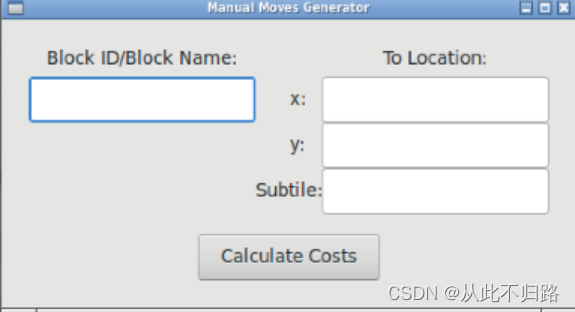
On the manual move window, the user can specify the Block ID/Block name of the block to move and the To location, with the x position, y position and subtile position. For the manual move to be valid:
在手动移动窗口中,用户可以指定要移动的块的块ID/块名称以及目标位置,包括x位置、y位置和子图块位置。为了使手动移动有效:
The To location requested by the user should be within the grid’s dimensions.
用户请求的目标位置应该在网格的尺寸范围内。
The block to be moved is found, valid and not fixed.
要移动的块必须存在、有效且非固定(not fixed)状态。
The blocks to be swapped are compatible.
要交换的块必须是兼容的。
The location choosen by the user is different from the block’s current location.
用户选择的位置必须与块的当前位置不同。
If the manual move is legal, the cost summary window will display the delta cost, delta timing, delta bounding box cost and the placer’s annealing decision that would result from this move.
如果手动移动是合法的,成本摘要窗口将显示由此移动导致的增量成本、增量时序、增量边界框成本以及布局器的退火决策。
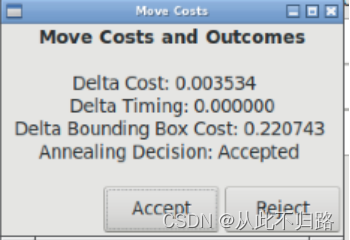
The user can Accept or Reject the manual move based on the values provided. If accepted the block’s new location is shown.
根据提供的数值,用户可以接受或拒绝手动移动。如果接受,将显示块的新位置。
*原文位置Graphics — Verilog-to-Routing 8.1.0-dev documentation (verilogtorouting.org)
版权声明:本文内容由互联网用户自发贡献,该文观点仅代表作者本人。本站仅提供信息存储空间服务,不拥有所有权,不承担相关法律责任。如发现本站有涉嫌侵权/违法违规的内容,请联系我们,一经查实,本站将立刻删除。
如需转载请保留出处:https://51itzy.com/kjqy/43954.html