
在折线图分析时,绘制直线辅助分析会时常用到,在此开发一个控件可以在折线图上绘制直线
目录
效果:
代码:
使用:
效果:
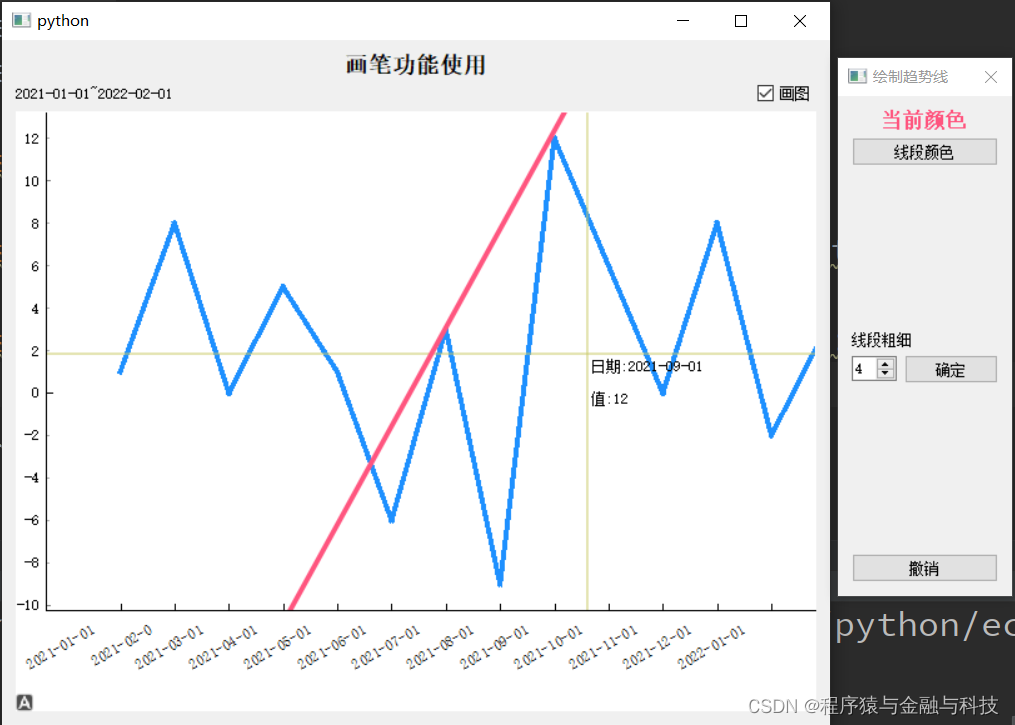

选择直线所在的两点前后点击,就会在此两点上生成一条直线,绘制完成后的直线可以平移 。可以绘制多条直线
代码:
导入需要用到的包
import sys,math from PyQt5 import QtCore,QtGui,QtWidgets from PyQt5.QtCore import Qt from typing import Dict,Any,List import pyqtgraph as pg pg.setConfigOption('background','w') pg.setConfigOption('foreground','k')讯享网
字符串坐标系,用以显示日期
讯享网class RotateAxisItem(pg.AxisItem): def drawPicture(self, p, axisSpec, tickSpecs, textSpecs): p.setRenderHint(p.Antialiasing,False) p.setRenderHint(p.TextAntialiasing,True) draw long line along axis pen,p1,p2 = axisSpec p.setPen(pen) p.drawLine(p1,p2) p.translate(0.5,0) resolves some damn pixel ambiguity draw ticks for pen,p1,p2 in tickSpecs: p.setPen(pen) p.drawLine(p1,p2) draw all text # if self.tickFont is not None: # p.setFont(self.tickFont) p.setPen(self.pen()) for rect,flags,text in textSpecs: # this is the important part p.save() p.translate(rect.x(),rect.y()) p.rotate(-30) p.drawText(-rect.width(),rect.height(),rect.width(),rect.height(),flags,text) # restoring the painter is *required*!!! p.restore()
绘制时,线条属性设置弹出框
class DrawLineSegmentWidget(QtWidgets.QWidget): sinout_signal = QtCore.pyqtSignal(object) def __init__(self): super().__init__() self.default_color: str = '#ff557f' self.init_ui() pass def init_ui(self): self.setWindowFlags(Qt.WindowStaysOnTopHint | Qt.WindowCloseButtonHint) self.setWindowTitle('绘制趋势线') self.setMinimumHeight(400) self.setMinimumWidth(100) self.current_color_label = QtWidgets.QLabel('当前颜色') self.current_color_label.setAlignment(Qt.AlignCenter) self.current_color_label.setStyleSheet('QLabel{font-size:16px;color:'+self.default_color+';font-weight:bold}') change_color_btn = QtWidgets.QPushButton('线段颜色') change_color_btn.clicked.connect(self.change_color_btn_clicked) layout_color = QtWidgets.QVBoxLayout() layout_color.addWidget(self.current_color_label) layout_color.addWidget(change_color_btn) layout_color.addStretch(1) tip_linewidth_label = QtWidgets.QLabel('线段粗细') self.linewidth_spin = QtWidgets.QSpinBox() self.linewidth_spin.setValue(4) linewidth_check_btn = QtWidgets.QPushButton('确定') linewidth_check_btn.clicked.connect(self.linewidth_check_btn_clicked) layout_linewidth = QtWidgets.QHBoxLayout() layout_linewidth.addWidget(self.linewidth_spin) layout_linewidth.addWidget(linewidth_check_btn) layout_linewidth_00 = QtWidgets.QVBoxLayout() layout_linewidth_00.addWidget(tip_linewidth_label) layout_linewidth_00.addLayout(layout_linewidth) layout_linewidth_00.addStretch(1) previous_step_btn = QtWidgets.QPushButton('撤销') previous_step_btn.clicked.connect(self.previous_step_btn_clicked) layout = QtWidgets.QVBoxLayout() layout.addLayout(layout_color) layout.addLayout(layout_linewidth_00) layout.addWidget(previous_step_btn) self.setLayout(layout) pass def change_color_btn_clicked(self): col = QtWidgets.QColorDialog.getColor() if col.isValid(): pal = self.current_color_label.palette() pal.setColor(QtGui.QPalette.WindowText,col) self.current_color_label.setPalette(pal) pre_map = { 'change_type':'color', 'data':col.name() } self.sinout_signal.emit(pre_map) pass def previous_step_btn_clicked(self): pre_map = { 'change_type': 'pre_step', 'data': None } self.sinout_signal.emit(pre_map) pass def linewidth_check_btn_clicked(self): line_width = self.linewidth_spin.value() if int(line_width)<=0: QtWidgets.QMessageBox.information( self, '提示', '线条粗细必须大于0', QtWidgets.QMessageBox.Yes ) return # linewidth pre_map = { 'change_type':'linewidth', 'data':int(line_width) } self.sinout_signal.emit(pre_map) pass曲线控件
讯享网class PyQtGraphLineWidget(QtWidgets.QWidget):
    def __init__(self):
        super().__init__()
        self.init_data()
        self.init_ui()

    def init_data(self):
        self.drawing_line_list = []
        self.drawing_line = None
        self.line_first_point = None
        self.line_second_point = None
        self.draw_line_yeah: bool = False
        self.segment_list: List = []
        self.draw_widget: QtWidgets.QWidget = None
        self.draw_line_color: str = '#ff557f'
        self.draw_line_width: int = 4
        # 颜色值 https://www.sioe.cn/yingyong/yanse-rgb-16/
        self.color_one = (30, 144, 255)
        pass

    def init_ui(self):
        self.title_label = QtWidgets.QLabel('折线图')
        self.title_label.setAlignment(Qt.AlignCenter)
        self.title_label.setStyleSheet('QLabel{font-size:18px;font-weight:bold;}')

        self.tip_label = QtWidgets.QLabel('左边界~右边界')
        self.draw_lines_checkbox = QtWidgets.QCheckBox('画图')
        self.draw_lines_checkbox.clicked.connect(self.draw_lines_checkbox_clicked)
        layout_control = QtWidgets.QHBoxLayout()
        layout_control.addWidget(self.tip_label)
        layout_control.addStretch(1)
        layout_control.addWidget(self.draw_lines_checkbox)

        xax = RotateAxisItem(orientation='bottom')
        xax.setHeight(h=80)
        self.pw = pg.PlotWidget(axisItems={'bottom': xax})
        self.pw.setMouseEnabled(x=True, y=False)
        # self.pw.enableAutoRange(x=False,y=True)
        self.pw.setAutoVisible(x=False, y=True)
        layout = QtWidgets.QVBoxLayout()
        layout.addWidget(self.title_label)
        layout.addLayout(layout_control)
        layout.addWidget(self.pw)
        self.setLayout(layout)
        pass

    def set_data(self, data: Dict[str, Any]):
        self.set_data_1(data)
        self.proxy_clicked = pg.SignalProxy(self.pw.scene().sigMouseClicked, rateLimit=60, slot=self.mouseClicked)

    def set_data_1(self, data: Dict[str, Any]):
        '''单根y轴'''
        if data is None:
            self.pw.clear()
            return
        # 将上一次视图清空
        self.pw.clear()
        self.pw.addLegend()
        title_str = data['title_str']
        self.title_label.setText(title_str)
        xTick = [data['xTick00']]
        x = data['x']
        y = data['y']
        whole_data = data['whole_data']
        self.y_datas = y
        self.x_data = xTick
        self.x_Tick = data['xTick']
        self.whole_data = whole_data
        self.tip_label.setText(f"{xTick[0][0][1]}~{xTick[0][-1][1]}")

        xax = self.pw.getAxis('bottom')
        xax.setTicks(xTick)

        self.pw.plot(x, y, connect='finite', pen=pg.mkPen({'color': self.color_one, 'width': 4}))

        self.vLine = pg.InfiniteLine(angle=90, movable=False)
        self.hLine = pg.InfiniteLine(angle=0, movable=False)
        self.label = pg.TextItem()

        self.pw.addItem(self.vLine, ignoreBounds=True)
        self.pw.addItem(self.hLine, ignoreBounds=True)
        self.pw.addItem(self.label, ignoreBounds=True)
        self.vb = self.pw.getViewBox()
        self.proxy = pg.SignalProxy(self.pw.scene().sigMouseMoved, rateLimit=60, slot=self.mouseMoved)
        # 显示整条折线图
        self.pw.enableAutoRange()
        pass

    def mouseMoved(self, evt):
        pos = evt[0]
        if self.pw.sceneBoundingRect().contains(pos):
            mousePoint = self.vb.mapSceneToView(pos)
            index = int(mousePoint.x())
            if index >= 0 and index < len(self.whole_data):
                cur_data = self.whole_data[index]
                html_str = ''
                for k, v in cur_data.items():
                    html_str += '<p style="color:black;">' + k + ':' + str(v) + '</p>'
                self.label.setHtml(html_str)
                self.label.setPos(mousePoint.x(), mousePoint.y())
                pass
            self.vLine.setPos(mousePoint.x())
            self.hLine.setPos(mousePoint.y())

            if self.draw_line_yeah:
                if self.line_first_point is not None:
                    second_point = mousePoint
                    angle = math.atan2((second_point.y() - self.line_first_point.y()),
                                       (second_point.x() - self.line_first_point.x()))
                    theta = angle * (180 / math.pi)
                    self.drawing_line.setAngle(theta)
        pass

    def mouseClicked(self, evt):
        if not self.draw_line_yeah:
            pass
        else:
            pos = evt[0].pos()
            if self.pw.sceneBoundingRect().contains(pos):
                mousePoint = self.vb.mapSceneToView(pos)
                if self.line_first_point is None:
                    self.line_first_point = mousePoint
                    self.drawing_line = pg.InfiniteLine(pos=mousePoint,angle=90, movable=False,pen={'color': self.draw_line_color, 'width': self.draw_line_width})
                    self.pw.addItem(self.drawing_line)
                else:
                    self.line_second_point = mousePoint
                    # 计算与起始点的角度
                    angle = math.atan2((self.line_second_point.y()-self.line_first_point.y()),(self.line_second_point.x()-self.line_first_point.x()))
                    theta = angle*(180/math.pi)
                    self.drawing_line.setAngle(theta)
                    self.drawing_line.setMovable(True)

                    self.drawing_line_list.append(self.drawing_line)

                    self.drawing_line = None
                    self.line_first_point = None
                    self.line_second_point = None
                    pass
        pass

    def draw_lines_checkbox_clicked(self):
        if self.draw_lines_checkbox.isChecked():
            self.draw_line_yeah = True
            if self.draw_widget is None:
                self.draw_widget = DrawLineSegmentWidget()
                self.draw_widget.sinout_signal.connect(self.draw_widget_sinout_signal_emit)
            self.draw_widget.show()
            pass
        else:
            self.draw_line_yeah = False
            for item in self.drawing_line_list:
                self.pw.removeItem(item)
            self.drawing_line_list.clear()
            if self.draw_widget:
                self.draw_widget.close()
            pass
        pass

    def draw_widget_sinout_signal_emit(self, data: Dict[str, Any]):
        change_type = data['change_type']
        if change_type == 'color':
            self.draw_line_color = data['data']
        elif change_type == 'linewidth':
            self.draw_line_width = data['data']
        elif change_type == 'pre_step':
            if len(self.drawing_line_list) >= 1:
                last_item = self.drawing_line_list[-1]
                self.pw.removeItem(last_item)
                self.drawing_line_list.pop()
        pass

    pass
使用:
if __name__ == '__main__': temp_map = {} temp_map['xTick'] = [(0, '2021-01-01'), (1, '2021-02-0'), (2, '2021-03-01'), (3, '2021-04-01'), (4, '2021-05-01'), (5, '2021-06-01'), (6, '2021-07-01'), (7, '2021-08-01'), (8, '2021-09-01'), (9, '2021-10-01'), (10, '2021-11-01'), (11, '2021-12-01'), (12, '2022-01-01'), (13, '2022-02-01'), ] temp_map['xTick00'] = temp_map['xTick'] temp_map['x'] = [0, 1, 2, 3, 4, 5, 6, 7, 8, 9, 10, 11, 12, 13] temp_map['y'] = [1, 8, 0, 5, 1, -6, 3, -9, 12, 6, 0, 8, -2, 3] temp_map['title_str'] = '画笔功能使用' temp_map['whole_data'] = [{'日期': '2021-01-01', '值': 1}, {'日期': '2021-02-01', '值': 8}, {'日期': '2021-03-01', '值': 0}, {'日期': '2021-04-01', '值': 5}, {'日期': '2021-05-01', '值': 1}, {'日期': '2021-06-01', '值': -6}, {'日期': '2021-07-01', '值': 3}, {'日期': '2021-08-01', '值': -9}, {'日期': '2021-09-01', '值': 12}, {'日期': '2021-10-01', '值': 6}, {'日期': '2021-11-01', '值': 0}, {'日期': '2021-12-01', '值': 8}, {'日期': '2022-01-01', '值': -2}, {'日期': '2022-02-01', '值': 3}] QtCore.QCoreApplication.setAttribute(QtCore.Qt.HighDpiScaleFactorRoundingPolicy.PassThrough) app = QtWidgets.QApplication(sys.argv) temp_widget = PyQtGraphLineWidget() temp_widget.set_data(temp_map) temp_widget.show() sys.exit(app.exec_()) pass
版权声明:本文内容由互联网用户自发贡献,该文观点仅代表作者本人。本站仅提供信息存储空间服务,不拥有所有权,不承担相关法律责任。如发现本站有涉嫌侵权/违法违规的内容,请联系我们,一经查实,本站将立刻删除。
如需转载请保留出处:https://51itzy.com/kjqy/42876.html