
目录
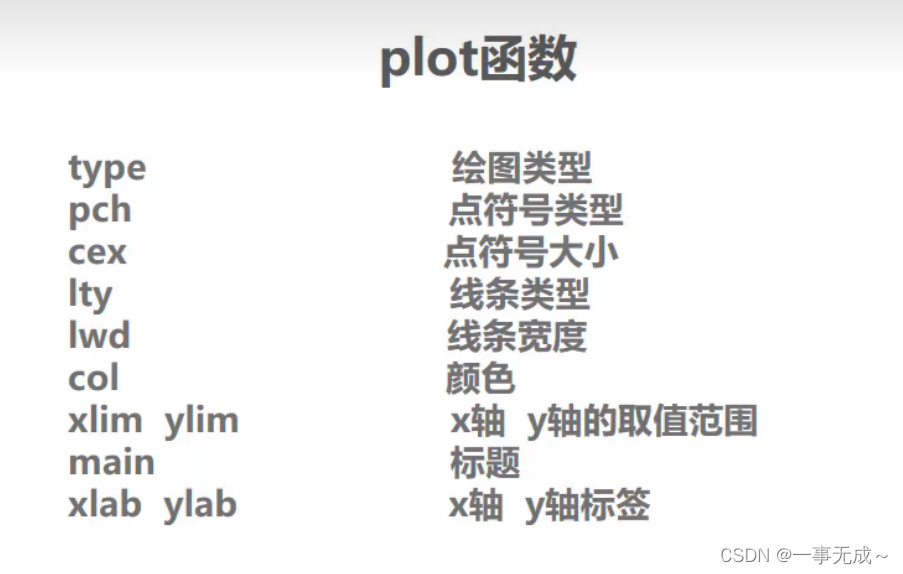
plot函数:
type绘图类型
一页多图画法
pch点符号类型
cex控制点的大小
lty线条类型
lwd线条宽度
col颜色
xlim ylim 坐标轴取值范围
main sub 主副标题
xlab,ylab 标签
plot函数:
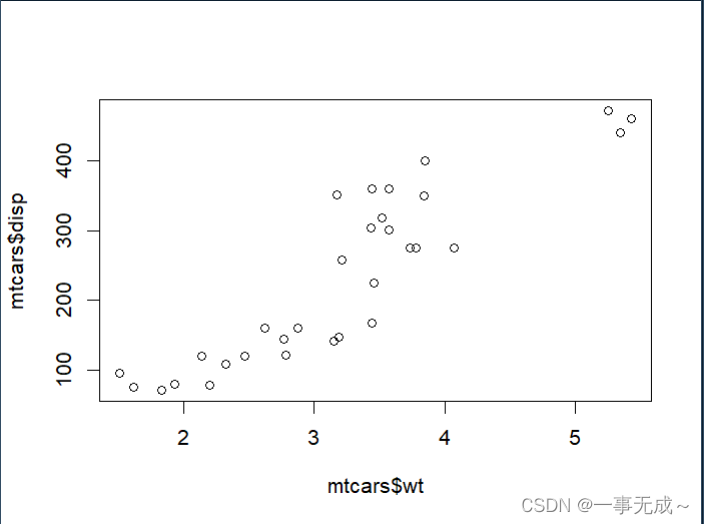
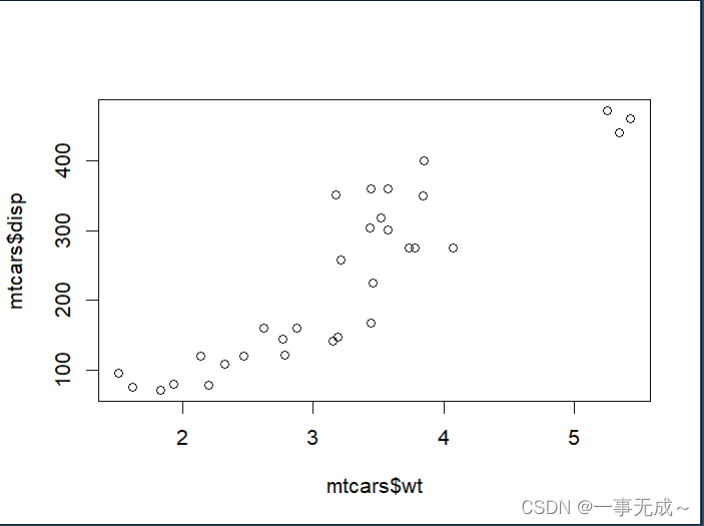
mtcars是一个内置的演示用的数据集,方便用户直接拿这些示例数据试验某些作图功能,下面使用mtcars作图演示。

plot(mtcars$wt)

plot(mtcars$wt,mtcars$disp)
plot(mtcars)

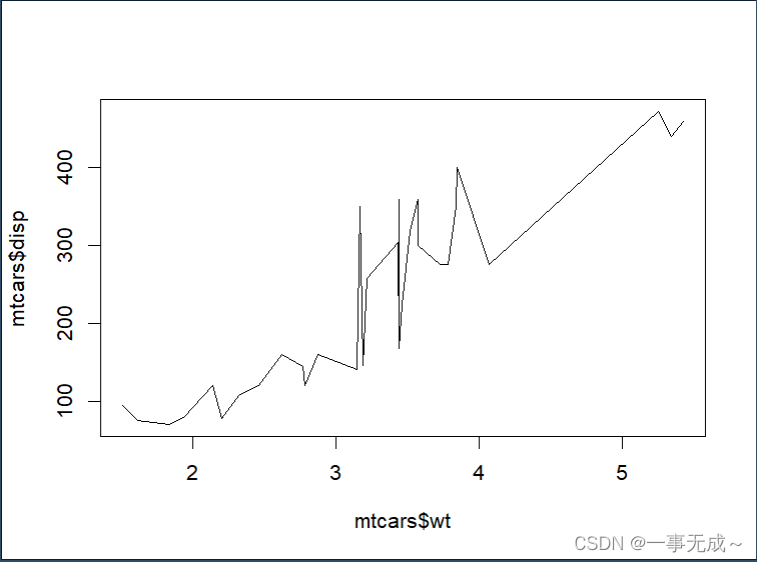
type绘图类型
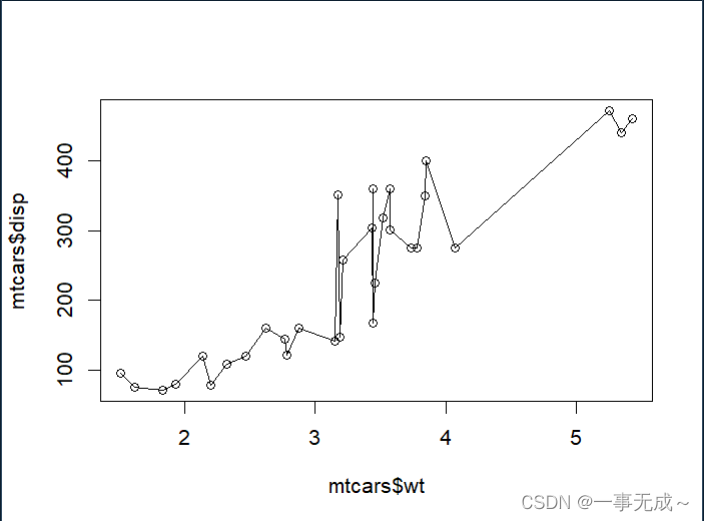
p表示点,l表示线,b表示下划线,其他o,h,s,S
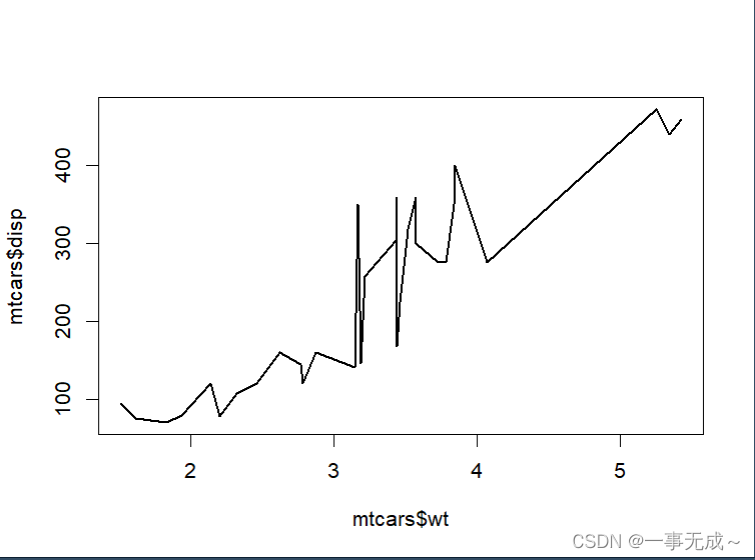
mtcars<-mtcars[order(mtcars$wt),]
plot(mtcars$wt,mtcars$disp,type='l')
plot(mtcars$wt,mtcars$disp,type='b')
plot(mtcars$wt,mtcars$disp,type='p')
plot(mtcars$wt,mtcars$disp,type='o')
plot(mtcars$wt,mtcars$disp,type='h')
plot(mtcars$wt,mtcars$disp,type='s')
plot(mtcars$wt,mtcars$disp,type='S')
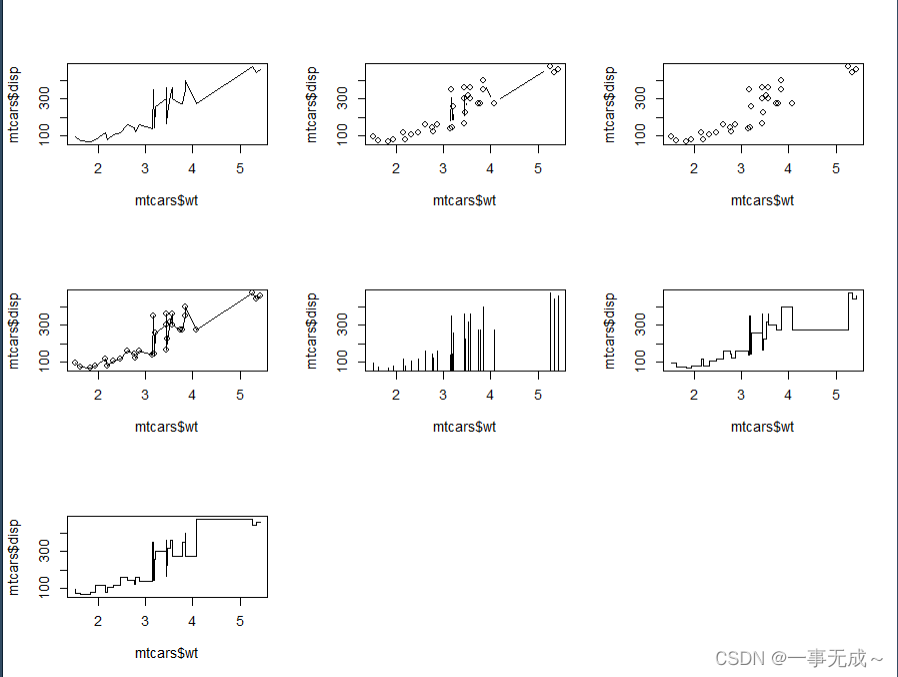
一页多图画法
par(mfrow=c(3,3))#三行三列
mtcars<-mtcars[order(mtcars$wt),]
plot(mtcars$wt,mtcars$disp,type='l')
plot(mtcars$wt,mtcars$disp,type='b')
plot(mtcars$wt,mtcars$disp,type='p')
plot(mtcars$wt,mtcars$disp,type='o')
plot(mtcars$wt,mtcars$disp,type='h')
plot(mtcars$wt,mtcars$disp,type='s')
plot(mtcars$wt,mtcars$disp,type='S')


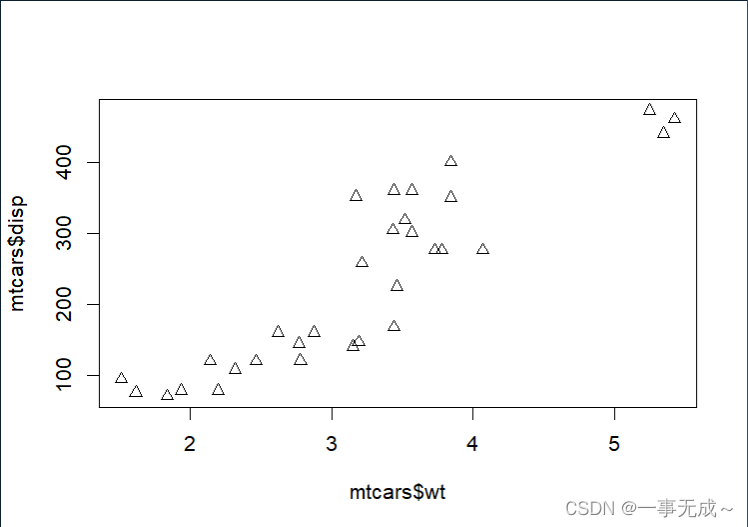
pch点符号类型
plot(mtcars$wt,mtcars$disp,pch=2)
plot(mtcars$wt,mtcars$disp,pch=1)
其余自己测试
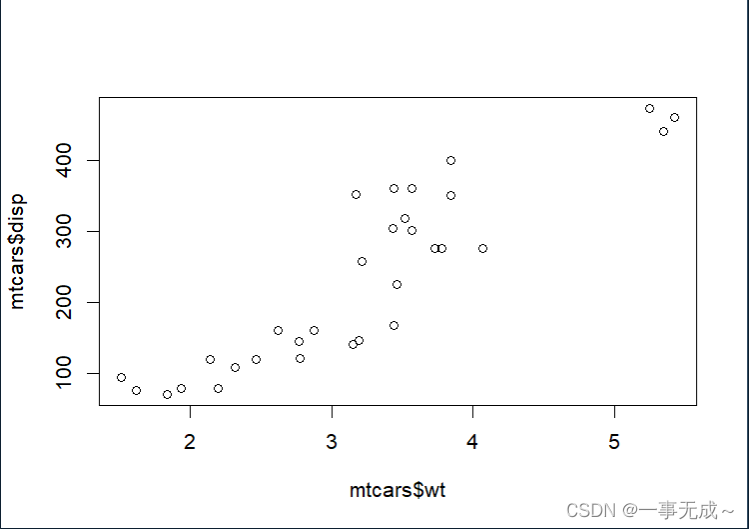
cex控制点的大小
plot(mtcars$wt,mtcars$disp,pch=1,cex=1.5)
#默认是1, 1.5就是默认大小的1.5倍

lty线条类型
par(mfrow=c(3,2))
plot(mtcars$wt,mtcars$disp,type='l',lty=1)
plot(mtcars$wt,mtcars$disp,type='l',lty=2)
plot(mtcars$wt,mtcars$disp,type='l',lty=3)
plot(mtcars$wt,mtcars$disp,type='l',lty=4)
plot(mtcars$wt,mtcars$disp,type='l',lty=5)
plot(mtcars$wt,mtcars$disp,type='l',lty=6)

lwd线条宽度
col颜色
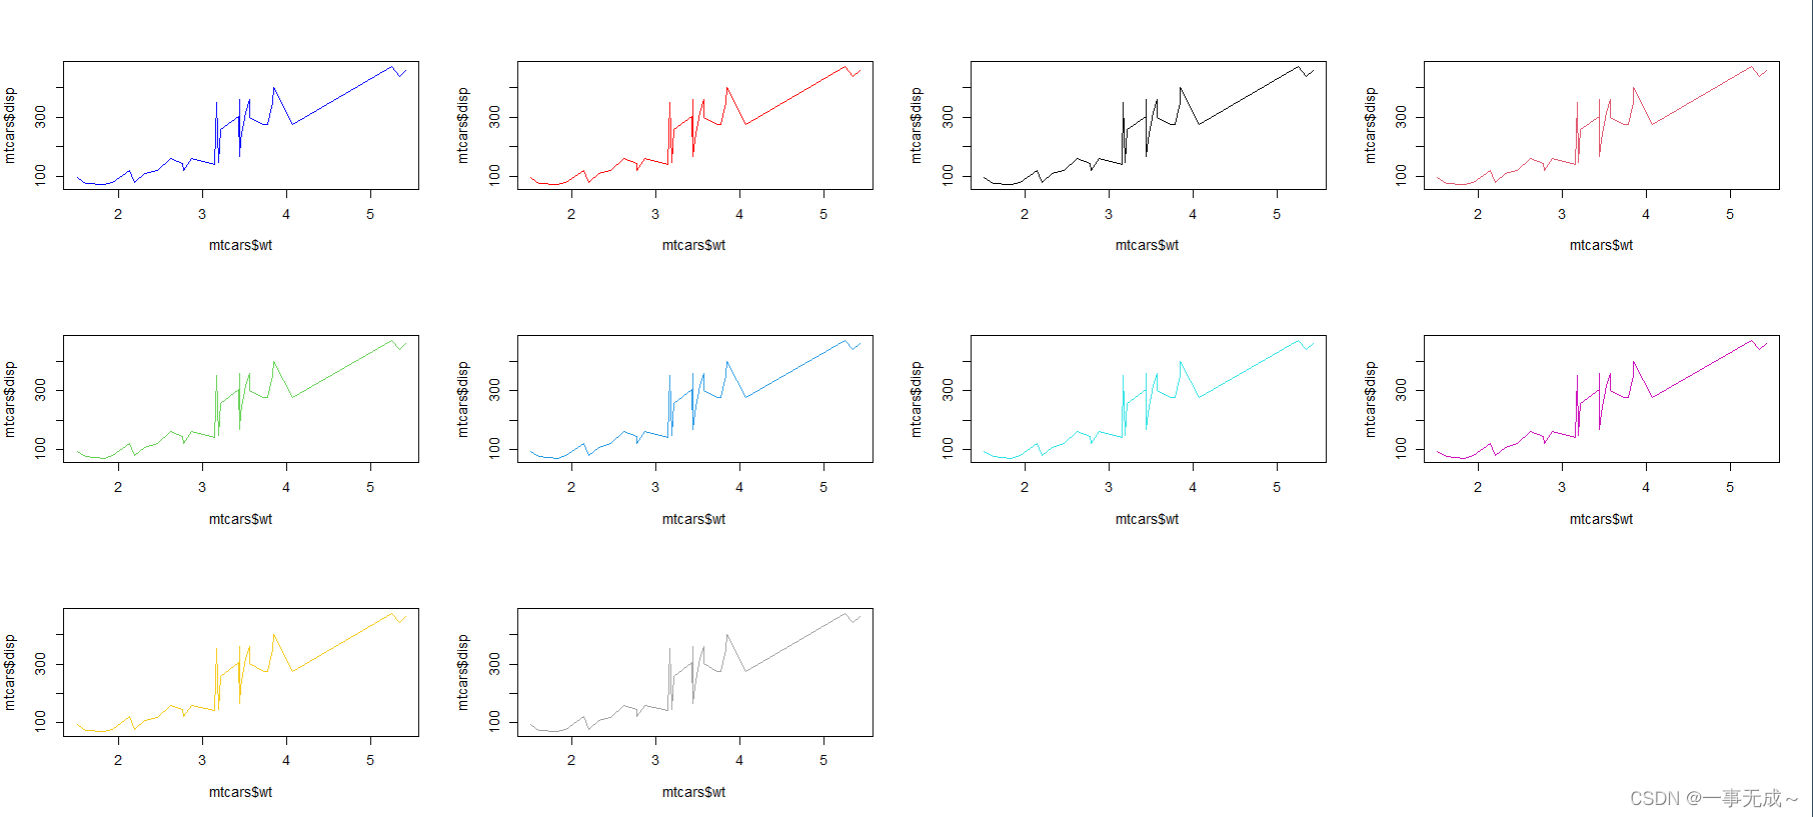
par(mfrow=c(3,4))
plot(mtcars$wt,mtcars$disp,type='l',lty=1,col='blue')
plot(mtcars$wt,mtcars$disp,type='l',lty=1,col='red')
plot(mtcars$wt,mtcars$disp,type='l',lty=1,col=1)
plot(mtcars$wt,mtcars$disp,type='l',lty=1,col=2)
plot(mtcars$wt,mtcars$disp,type='l',lty=1,col=3)
plot(mtcars$wt,mtcars$disp,type='l',lty=1,col=4)
plot(mtcars$wt,mtcars$disp,type='l',lty=1,col=5)
plot(mtcars$wt,mtcars$disp,type='l',lty=1,col=6)
plot(mtcars$wt,mtcars$disp,type='l',lty=1,col=7)
plot(mtcars$wt,mtcars$disp,type='l',lty=1,col=8)#直接使用颜色名字或者数字1-8
#或者使用十六进制颜色或rgb函数

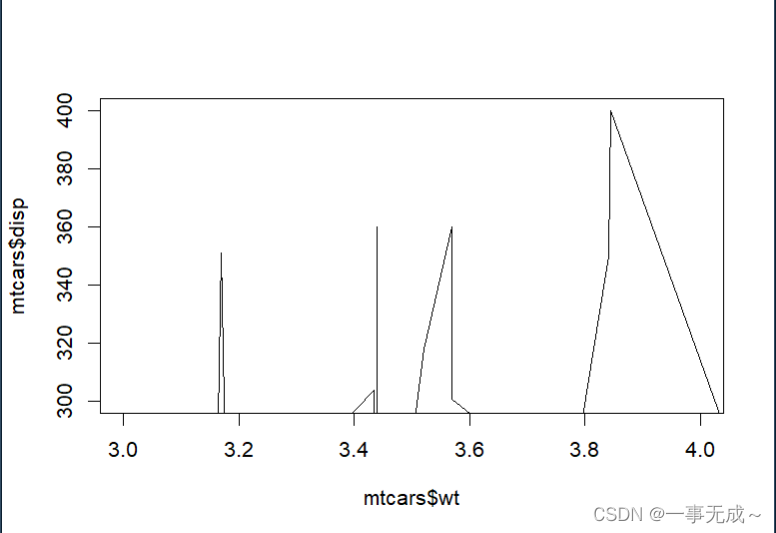
xlim ylim 坐标轴取值范围
plot(mtcars$wt,mtcars$disp,type='l',xlim=c(3,4),ylim=c(300,400))
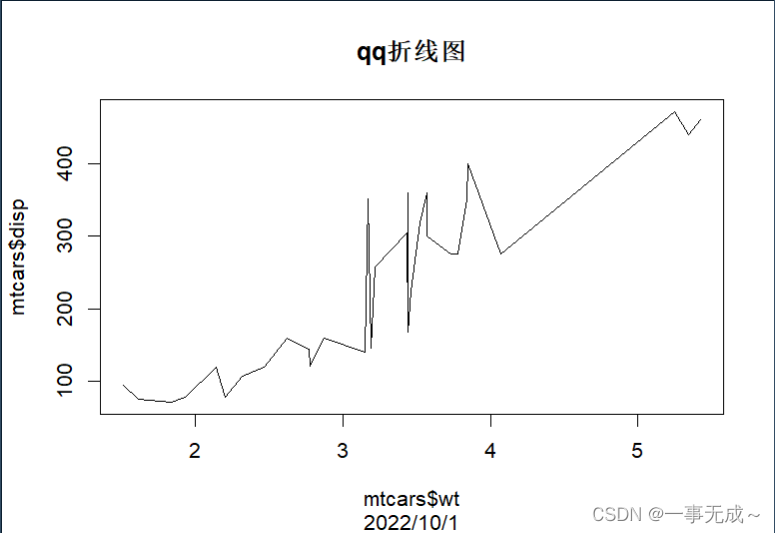
main sub 主副标题
plot(mtcars$wt,mtcars$disp,type='l',lty=1,main='折线图',sub='2022/10/1')
xlab,ylab 标签
plot(mtcars$wt,mtcars$disp,type='l',lty=1,main='折线图',sub='2022/10/1',xlab='x轴标签',ylab='y轴标签')

版权声明:本文内容由互联网用户自发贡献,该文观点仅代表作者本人。本站仅提供信息存储空间服务,不拥有所有权,不承担相关法律责任。如发现本站有涉嫌侵权/违法违规的内容,请联系我们,一经查实,本站将立刻删除。
如需转载请保留出处:https://51itzy.com/kjqy/40185.html