
一、机器学习概览
0 检查版本信息
import sys assert sys.version_info >= (3, 5) sys.version_info 讯享网

讯享网import sklearn assert sklearn.__version__ >= "0.20" sklearn.__version__

1 获取数据并整理
1.1 下载数据
创建
datasets/lifesat目录
爬取oecd_bli_2015.csv&gdp_per_capita.csv数据到该目录下
import os datapath = os.path.join("datasets", "lifesat", "") # 拼接 import urllib DOWNLOAD_ROOT = "https://raw.githubusercontent.com/ageron/handson-ml2/master/" os.makedirs(datapath, exist_ok=True) for filename in ("oecd_bli_2015.csv", "gdp_per_capita.csv"): print("Downloading", filename) url = DOWNLOAD_ROOT + "datasets/lifesat/" + filename urllib.request.urlretrieve(url, datapath + filename) 
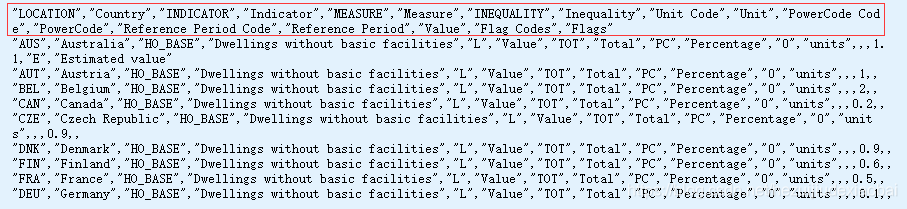
讯享网!tree datasets !head -10 datasets/lifesat//oecd_bli_2015.csv
!head -10 datasets/lifesat//gdp_per_capita.csv 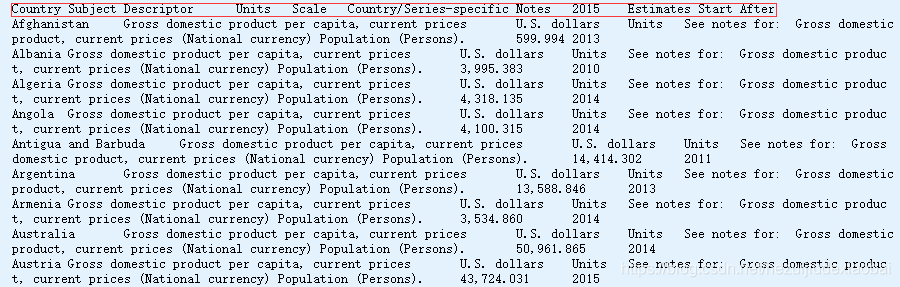
1.2 加载数据
pd.read_csv
thousands: str, default None
<>Thousands separator.
delimiter: str, defaultNone
<>Alternative argument name for sep.
encoding: str, default None
<>Encoding to use for UTF when reading/writing (ex. ‘utf-8’). List of Python standard encodings
na_values: scalar, str, list-like, or dict, default None
<>Additional strings to recognize as NA/NaN. If dict passed, specific
per-column NA values. By default the following values are interpreted as
NaN: ‘’, ‘#N/A’, ‘#N/A N/A’, ‘#NA’, ‘-1.#IND’, ‘-1.#QNAN’, ‘-NaN’, ‘-nan’,
‘1.#IND’, ‘1.#QNAN’, ‘N/A’, ‘NA’, ‘NULL’, ‘NaN’, ‘n/a’, ‘nan’,
‘null’.
讯享网import matplotlib.pyplot as plt import numpy as np import pandas as pd import sklearn.linear_model oecd_bli = pd.read_csv(datapath + "oecd_bli_2015.csv", thousands=',') gdp_per_capita = pd.read_csv(datapath + "gdp_per_capita.csv", thousands=',',delimiter='\t', encoding='latin1', na_values="n/a") oecd_bli.info()
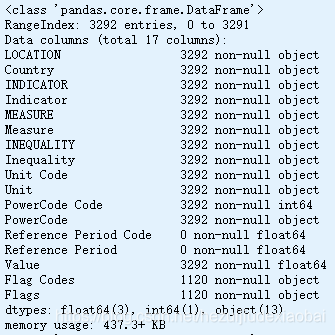
oecd_bli.shape 
讯享网gdp_per_capita.info()
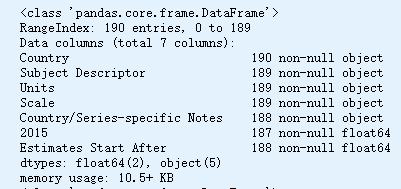
gdp_per_capita.shape 
直接下载数据
讯享网import pandas as pd oecd_bli_ = pd.read_csv("https://raw.githubusercontent.com/ageron/handson-ml/master/datasets/lifesat/oecd_bli_2015.csv", thousands=',') oecd_bli_.shape

import pandas as pd gdp_per_capita_ = pd.read_csv("https://raw.githubusercontent.com/ageron/handson-ml/master/datasets/lifesat/gdp_per_capita.csv", thousands=',',delimiter='\t', encoding='latin1', na_values="n/a") gdp_per_capita_.shape 
1.3 预处理数据
将
OECD's(经合组织)生活满意度数据和IMF's(国际货币基金组织)的人均GDP数据合并在一起
pd.DataFrame.pivot
pd.DataFrame.rename
pd.DataFrame.set_index
pd.DataFrame.merge
pd.DataFrame.sort_values
讯享网def prepare_country_stats(oecd_bli, gdp_per_capita): oecd_bli = oecd_bli[oecd_bli["INEQUALITY"]=="TOT"] # 过滤 oecd_bli = oecd_bli.pivot(index="Country", columns="Indicator", values="Value") # 透视 gdp_per_capita.rename(columns={"2015": "GDP per capita"}, inplace=True) # 更改轴标签 gdp_per_capita.set_index("Country", inplace=True) # 重置索引 full_country_stats = pd.merge(left=oecd_bli, right=gdp_per_capita, left_index=True, right_index=True) # 合并 full_country_stats.sort_values(by="GDP per capita", inplace=True) # 排序 remove_indices = [0, 1, 6, 8, 33, 34, 35] # 移除某些国家 keep_indices = list(set(range(36)) - set(remove_indices)) return full_country_stats[["GDP per capita", 'Life satisfaction']].iloc[keep_indices] # 全部国家信息
np.c_
country_stats = prepare_country_stats(oecd_bli, gdp_per_capita) X = np.c_[country_stats["GDP per capita"]] y = np.c_[country_stats["Life satisfaction"]] country_stats 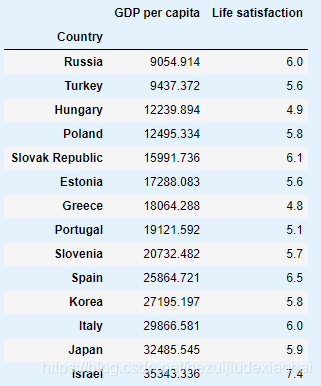
1.4 数据可视化
讯享网country_stats.plot(kind='scatter', x="GDP per capita", y='Life satisfaction') plt.show()
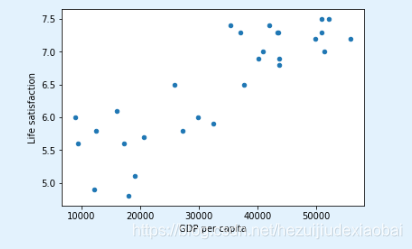
1.5 线性回归模型
# 线性回归模型 model = sklearn.linear_model.LinearRegression() # 训练 model.fit(X, y) # 预测 X_new = [[22587]] model.predict(X_new) 
2 基于模型学习
保存图片
讯享网PROJECT_ROOT_DIR = "." CHAPTER_ID = "fundamentals" IMAGES_PATH = os.path.join(PROJECT_ROOT_DIR, "images", CHAPTER_ID) # 拼接 os.makedirs(IMAGES_PATH, exist_ok=True) # 创建目录 def save_fig(fig_id, tight_layout=True, fig_extension="png", resolution=300): path = os.path.join(IMAGES_PATH, fig_id + "." + fig_extension) # 拼接 print("Saving figure", fig_id) if tight_layout: plt.tight_layout() # **位置 plt.savefig(path, format=fig_extension, dpi=resolution) !ls images

2.1 读取并准备Life satisfaction数据
oecd_bli = pd.read_csv(datapath + "oecd_bli_2015.csv", thousands=',') oecd_bli = oecd_bli[oecd_bli["INEQUALITY"]=="TOT"] oecd_bli = oecd_bli.pivot(index="Country", columns="Indicator", values="Value") oecd_bli.head() 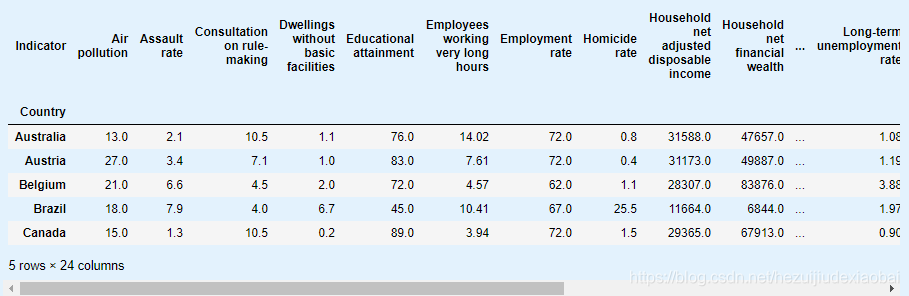
2.2 读取并准备GDP per capita数据
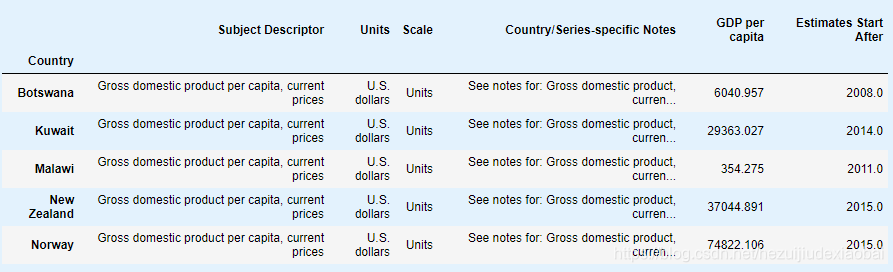
讯享网gdp_per_capita = pd.read_csv(datapath+"gdp_per_capita.csv", thousands=',', delimiter='\t', encoding='latin1', na_values="n/a") gdp_per_capita.rename(columns={"2015": "GDP per capita"}, inplace=True) gdp_per_capita.set_index("Country", inplace=True) gdp_per_capita.head()
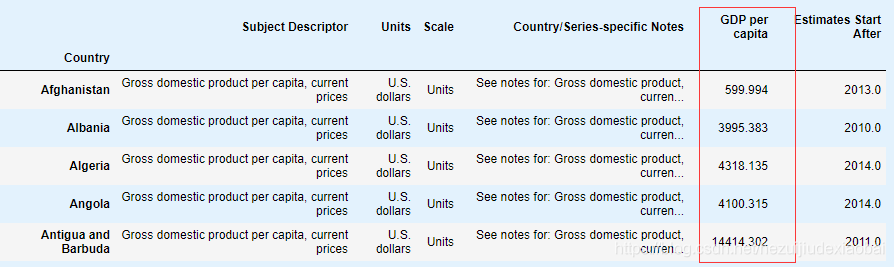
2.3 合并Life satisfaction & GDP per capita数据
full_country_stats = pd.merge(left=oecd_bli, right=gdp_per_capita, left_index=True, right_index=True) full_country_stats.sort_values(by="GDP per capita", inplace=True) full_country_stats 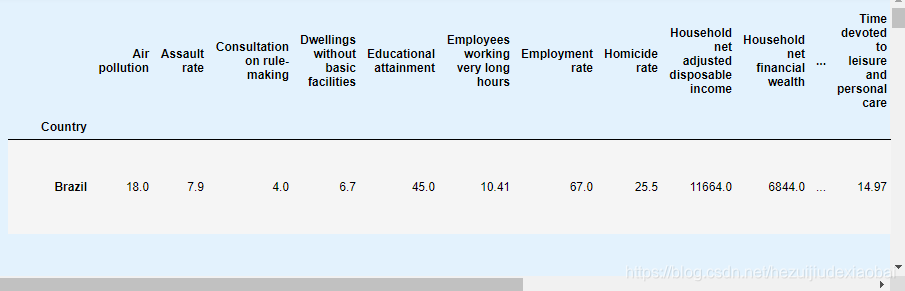
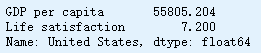
讯享网full_country_stats[["GDP per capita", 'Life satisfaction']].loc["United States"]
2.4 分割数据集
remove_indices = [0, 1, 6, 8, 33, 34, 35] keep_indices = list(set(range(36)) - set(remove_indices)) sample_data = full_country_stats[["GDP per capita", 'Life satisfaction']].iloc[keep_indices] missing_data = full_country_stats[["GDP per capita", 'Life satisfaction']].iloc[remove_indices] sample_data 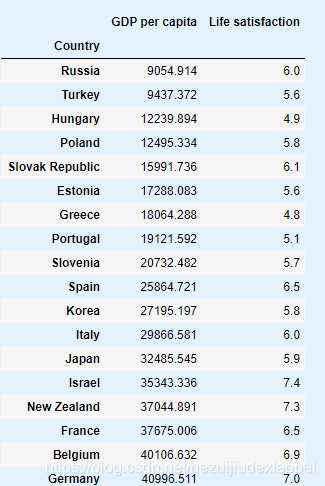
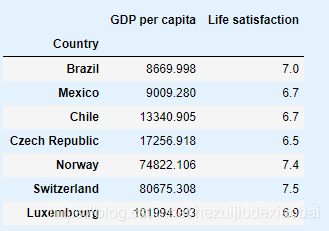
讯享网missing_data # 移除的国家数据

2.5 用一些国家画图
dict.items # 返回可遍历的(键, 值) 元组数组
plt.annotate # 用文本注释点
sample_data.plot(kind='scatter', x="GDP per capita", y='Life satisfaction', figsize=(5,3)) plt.axis([0, 60000, 0, 10]) 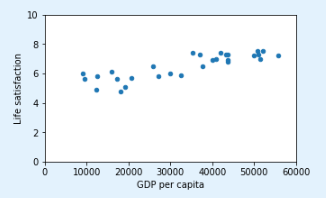
讯享网sample_data.plot(kind='scatter', x="GDP per capita", y='Life satisfaction', figsize=(5,3)) plt.axis([0, 60000, 0, 10]) # 设置轴属性 position_text = { # 文本&文本位置 "Hungary": (5000, 1), "Korea": (18000, 1.7), "France": (29000, 2.4), "Australia": (40000, 3.0), "United States": (52000, 3.8), } for country, pos_text in position_text.items(): # 字典 dict.items pos_data_x, pos_data_y = sample_data.loc[country] # 数据 country = "U.S." if country == "United States" else country # United States -> U.S. plt.annotate(country, xy=(pos_data_x, pos_data_y), xytext=pos_text, arrowprops=dict(facecolor='black', width=0.5, shrink=0.1, headwidth=5)) # 用文本注释点 plt.plot(pos_data_x, pos_data_y, "ro") plt.xlabel("GDP per capita (USD)") save_fig('money_happy_scatterplot') # 保存 plt.show()
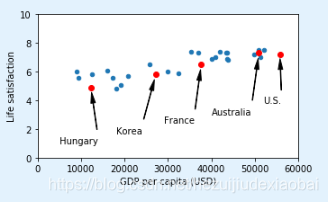
2.6 线性模型
sample_data.to_csv(os.path.join("datasets", "lifesat", "lifesat.csv")) position_text 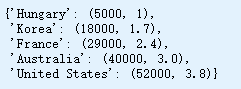
讯享网sample_data.loc[list(position_text.keys())]
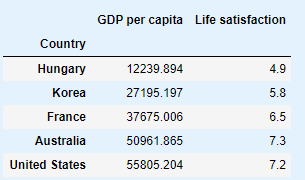
sample_data.plot(kind='scatter', x="GDP per capita", y='Life satisfaction', figsize=(5,3)) plt.xlabel("GDP per capita (USD)") plt.axis([0, 60000, 0, 10]) X=np.linspace(0, 60000, 1000) plt.plot(X, 2*X/, "r") plt.text(40000, 2.7, r"$\theta_0 = 0$", fontsize=14, color="r") plt.text(40000, 1.8, r"$\theta_1 = 2 \times 10^{-5}$", fontsize=14, color="r") plt.plot(X, 8 - 5*X/, "g") plt.text(5000, 9.1, r"$\theta_0 = 8$", fontsize=14, color="g") plt.text(5000, 8.2, r"$\theta_1 = -5 \times 10^{-5}$", fontsize=14, color="g") plt.plot(X, 4 + 5*X/, "y") plt.text(5000, 3.5, r"$\theta_0 = 4$", fontsize=14, color="y") plt.text(5000, 2.6, r"$\theta_1 = 5 \times 10^{-5}$", fontsize=14, color="y") save_fig('tweaking_model_params_plot') plt.show() 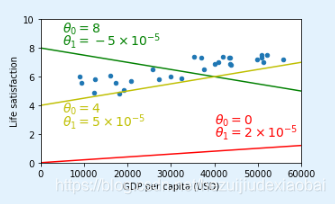
2.7 模型训练
讯享网from sklearn import linear_model lin1 = linear_model.LinearRegression() Xsample = np.c_[sample_data["GDP per capita"]] ysample = np.c_[sample_data["Life satisfaction"]] lin1.fit(Xsample, ysample) t0, t1 = lin1.intercept_[0], lin1.coef_[0][0] t0, t1

**拟合训练数据的线性模型
sample_data.plot(kind='scatter', x="GDP per capita", y='Life satisfaction', figsize=(5,3)) plt.xlabel("GDP per capita (USD)") plt.axis([0, 60000, 0, 10]) X=np.linspace(0, 60000, 1000) plt.plot(X, t0 + t1*X, "r") plt.text(5000, 3.1, r"$\theta_0 = 4.85$", fontsize=14, color="g") plt.text(5000, 2.2, r"$\theta_1 = 4.91 \times 10^{-5}$", fontsize=14, color="y") save_fig('best_fit_model_plot') plt.show() 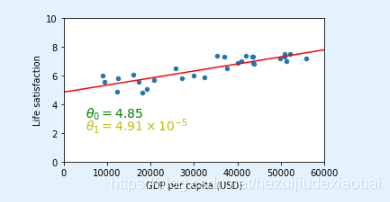
2.8 对Cyprus进行预测
塞浦路斯 地中海东部之一岛国,原属英,1960年独立,首都Nicosia
讯享网cyprus_predicted_life_satisfaction = lin1.predict([[cyprus_gdp_per_capita]])[0][0] cyprus_predicted_life_satisfaction

sample_data.plot(kind='scatter', x="GDP per capita", y='Life satisfaction', figsize=(5,3), s=10, c='g') plt.xlabel("GDP per capita (USD)") X=np.linspace(0, 60000, 1000) plt.plot(X, t0 + t1*X, "b") plt.axis([0, 60000, 0, 10]) plt.text(5000, 7.5, r"$\theta_0 = 4.85$", fontsize=14, color="b") plt.text(5000, 6.6, r"$\theta_1 = 4.91 \times 10^{-5}$", fontsize=14, color="b") plt.plot([cyprus_gdp_per_capita, cyprus_gdp_per_capita], [0, cyprus_predicted_life_satisfaction], "r--") # 虚线 plt.text(25000, 5.0, r"Prediction = 5.96", fontsize=14, color="b") plt.plot(cyprus_gdp_per_capita, cyprus_predicted_life_satisfaction, "ro") save_fig('cyprus_prediction_plot') plt.show() 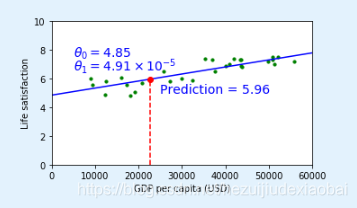
分析
讯享网sample_data[7:10]
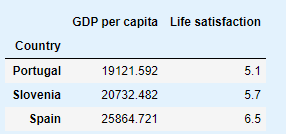
gdp_per_capita.loc["Cyprus"]["GDP per capita"] 
Slovenia≈ \approx ≈Cyprus(GDP per capita)
讯享网sample_data[7:10]['Life satisfaction'].mean()

预测值很接近
2.9 K近邻回归
import sklearn.neighbors model = sklearn.neighbors.KNeighborsRegressor(n_neighbors=3) X = np.c_[country_stats["GDP per capita"]] y = np.c_[country_stats["Life satisfaction"]] # Train the model model.fit(X, y) # Make a prediction for Cyprus X_new = np.array([[22587.0]]) # Cyprus' GDP per capita print(model.predict(X_new)) # outputs [[ 5.]] 
3 机器学习的主要挑战
3.1 没有代表性的训练数据
讯享网backup = oecd_bli, gdp_per_capita # 备份 def prepare_country_stats(oecd_bli, gdp_per_capita): oecd_bli = oecd_bli[oecd_bli["INEQUALITY"]=="TOT"] # 过滤 oecd_bli = oecd_bli.pivot(index="Country", columns="Indicator", values="Value") # 透视 gdp_per_capita.rename(columns={"2015": "GDP per capita"}, inplace=True) # 更改轴标签 gdp_per_capita.set_index("Country", inplace=True) # 重置索引 full_country_stats = pd.merge(left=oecd_bli, right=gdp_per_capita, left_index=True, right_index=True) # 合并 full_country_stats.sort_values(by="GDP per capita", inplace=True) # 排序 remove_indices = [0, 1, 6, 8, 33, 34, 35] # 移除某些国家 keep_indices = list(set(range(36)) - set(remove_indices)) return full_country_stats[["GDP per capita", 'Life satisfaction']].iloc[keep_indices] # 全部国家信息 oecd_bli, gdp_per_capita = backup # 回滚 missing_data
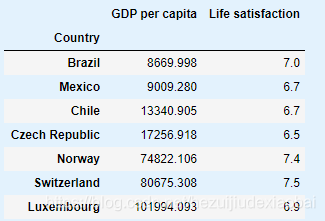
position_text2 = { "Brazil": (1000, 9.0), "Mexico": (11000, 9.0), "Chile": (25000, 9.0), "Czech Republic": (35000, 9.0), "Norway": (60000, 3), "Switzerland": (72000, 3.0), "Luxembourg": (90000, 3.0), } sample_data.plot(kind='scatter', x="GDP per capita", y='Life satisfaction', figsize=(8,3)) plt.axis([0, , 0, 10]) for country, pos_text in position_text2.items(): pos_data_x, pos_data_y = missing_data.loc[country] plt.annotate(country, xy=(pos_data_x, pos_data_y), xytext=pos_text, arrowprops=dict(facecolor='black', width=0.5, shrink=0.1, headwidth=5)) plt.plot(pos_data_x, pos_data_y, "rs") X=np.linspace(0, , 1000) plt.plot(X, t0 + t1*X, "b:") lin_reg_full = linear_model.LinearRegression() Xfull = np.c_[full_country_stats["GDP per capita"]] yfull = np.c_[full_country_stats["Life satisfaction"]] lin_reg_full.fit(Xfull, yfull) t0full, t1full = lin_reg_full.intercept_[0], lin_reg_full.coef_[0][0] X = np.linspace(0, , 1000) plt.plot(X, t0full + t1full * X, "k") plt.xlabel("GDP per capita (USD)") save_fig('representative_training_data_scatterplot') plt.show() 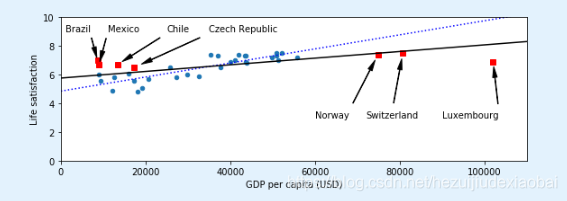
样本偏差
添加缺失国家后,发现一些贫穷国家看上去比富裕的国家还幸福
3.2 过拟合训练数据
讯享网full_country_stats.plot(kind='scatter', x="GDP per capita", y='Life satisfaction', figsize=(8,3)) plt.axis([0, , 0, 10]) from sklearn import preprocessing from sklearn import pipeline poly = preprocessing.PolynomialFeatures(degree=60, include_bias=False) # 生成多项式特征 scaler = preprocessing.StandardScaler() lin_reg2 = linear_model.LinearRegression() pipeline_reg = pipeline.Pipeline([('poly', poly), ('scal', scaler), ('lin', lin_reg2)]) # 管道 pipeline_reg.fit(Xfull, yfull) curve = pipeline_reg.predict(X[:, np.newaxis]) plt.plot(X, curve) plt.xlabel("GDP per capita (USD)") save_fig('overfitting_model_plot') plt.show()
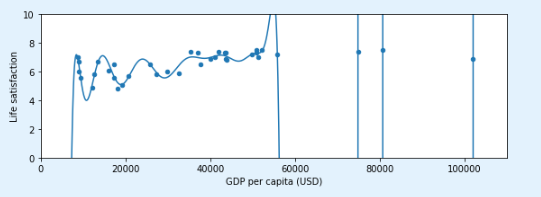
过度归纳
3.3 正则化
full_country_stats.loc[[c for c in full_country_stats.index if "W" in c.upper()]]["Life satisfaction"] 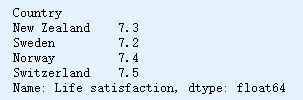
讯享网gdp_per_capita.loc[[c for c in gdp_per_capita.index if "W" in c.upper()]].head()
plt.figure(figsize=(8,3)) plt.xlabel("GDP per capita") plt.ylabel('Life satisfaction') plt.plot(list(sample_data["GDP per capita"]), list(sample_data["Life satisfaction"]), "bo") plt.plot(list(missing_data["GDP per capita"]), list(missing_data["Life satisfaction"]), "rs") X = np.linspace(0, , 1000) plt.plot(X, t0full + t1full * X, "r--", label="Linear model on all data") plt.plot(X, t0 + t1*X, "g:", label="Linear model on partial data") ridge = linear_model.Ridge(alpha=109.5) # 岭回归 Xsample = np.c_[sample_data["GDP per capita"]] ysample = np.c_[sample_data["Life satisfaction"]] ridge.fit(Xsample, ysample) t0ridge, t1ridge = ridge.intercept_[0], ridge.coef_[0][0] plt.plot(X, t0ridge + t1ridge * X, "b", label="Regularized linear model on partial data") plt.legend(loc="lower right") plt.axis([0, , 0, 10]) plt.xlabel("GDP per capita (USD)") save_fig('ridge_model_plot') plt.show() 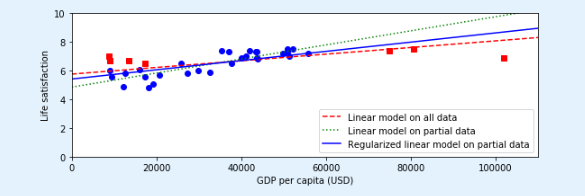
正则化降低了过度拟合的风险
版权声明:本文内容由互联网用户自发贡献,该文观点仅代表作者本人。本站仅提供信息存储空间服务,不拥有所有权,不承担相关法律责任。如发现本站有涉嫌侵权/违法违规的内容,请联系我们,一经查实,本站将立刻删除。
如需转载请保留出处:https://51itzy.com/kjqy/75261.html