
以下所有图片来源于MATLAB官方文档截图,仅用于学习与非盈利行为,若有侵权请及时联系博主删除。
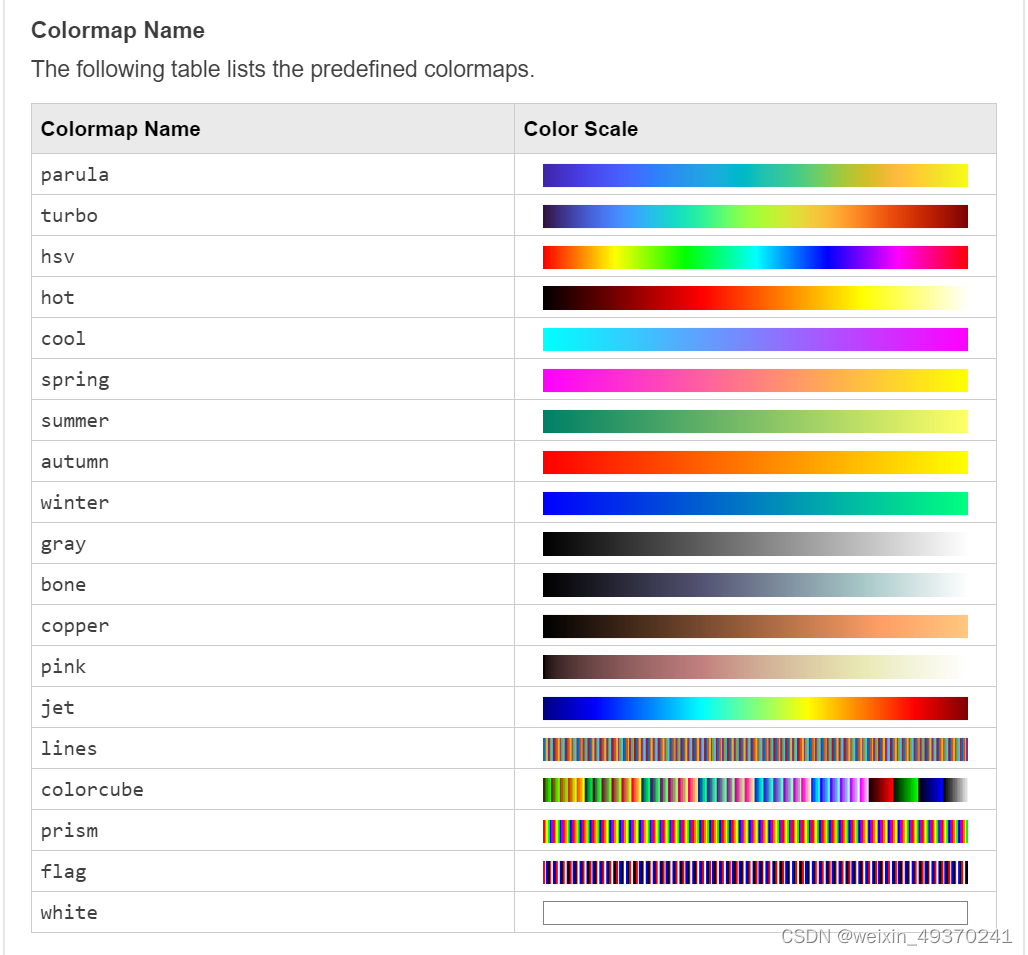
colormap函数实际上就是要应用一组RGB矩阵,指定图窗figure或坐标轴axes的颜色使用,一般是二维填色图contourf等函数。
colormap分别都是figure和axes的属性之一
用法如:
colormap('parula') colormap('cool') 等 c = parula(200) % 此命令生成200×3的RGB矩阵 (MATLAB自带的colormap) m_colmap('jet',200) % m_map函数生成RGB矩阵 (自指定的colormap) gcfc = get(gcf,'colormap'); % 获取当前figure的colormap矩阵 。一般是默认情况 set(gcf,'colormap',parula(200)) % 设置当前figure的colormap矩阵,为parula(200) gcac = get(gca,'colormap'); % 获取当前axes的colormap矩阵 。一般是默认情况 set(gca,'colormap',cool(200)) % 设置当前axes的colormap矩阵,为cool(200) 讯享网
讯享网
二. caxis
打开caxis函数文档;
caxis用法一:获取当前颜色限制范围 Get the current color limits.
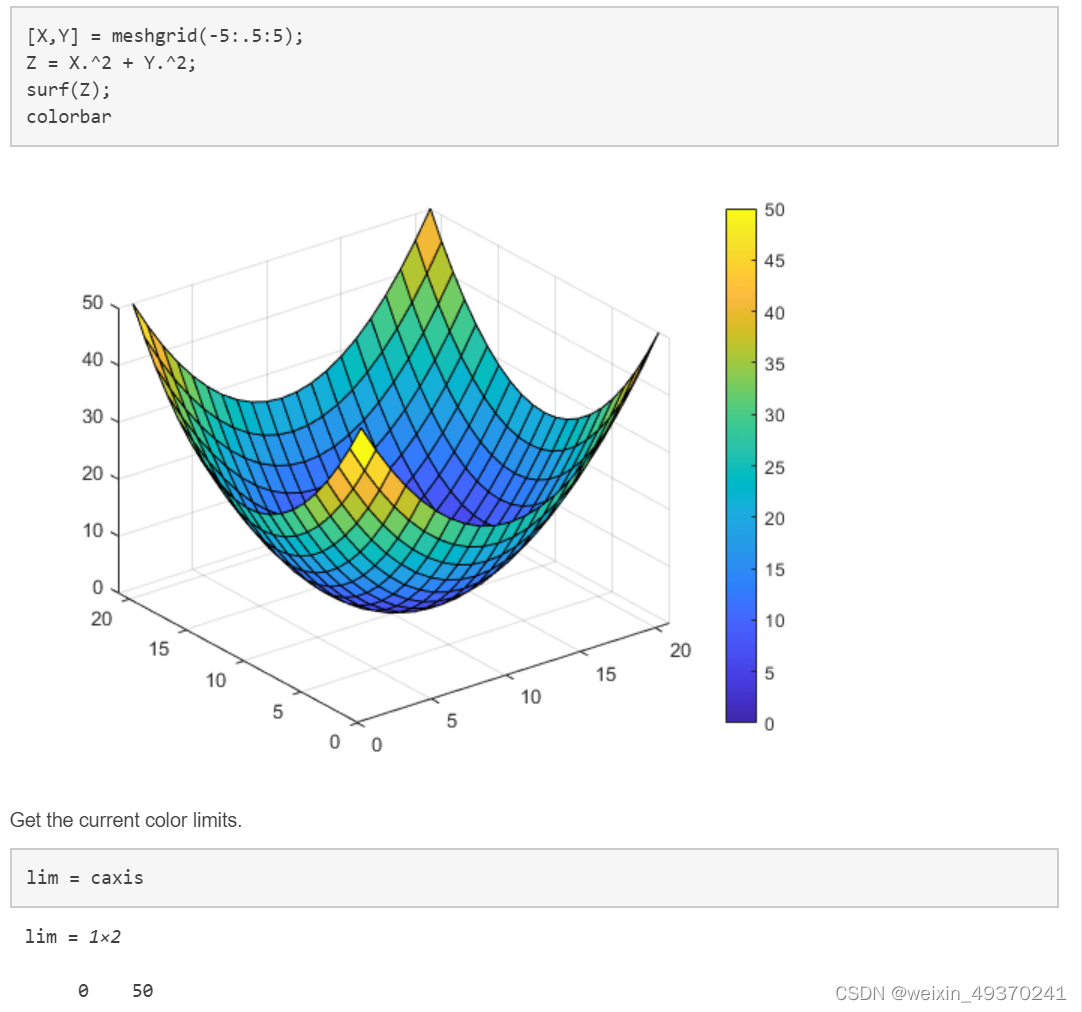
结果为[0 50] 这是Z的最小值与最大值。
caxis用法二:设置当前颜色限制范围 Set the current color limits. 所有小于等于20的值填色为当前colormap中对应最低值的颜色-蓝色
caxis([20 50])
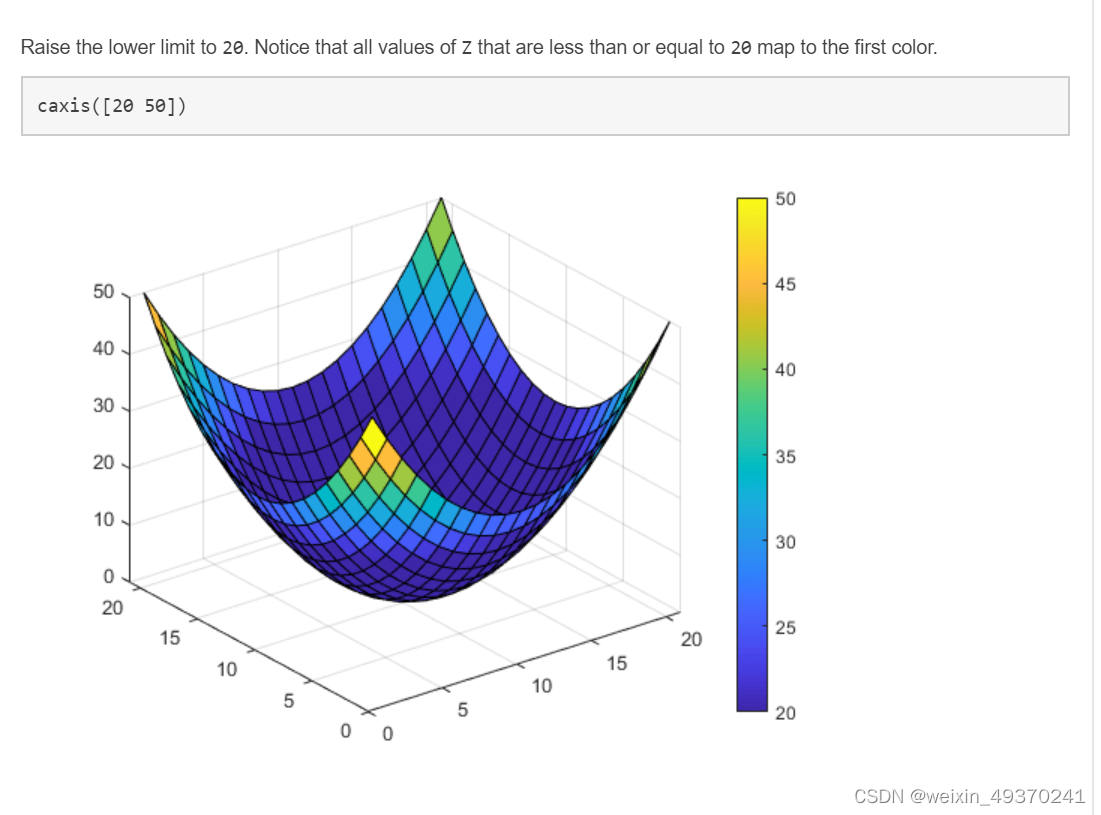
所有高于50的值填色为当前colormap中对应最高值的颜色-黄色
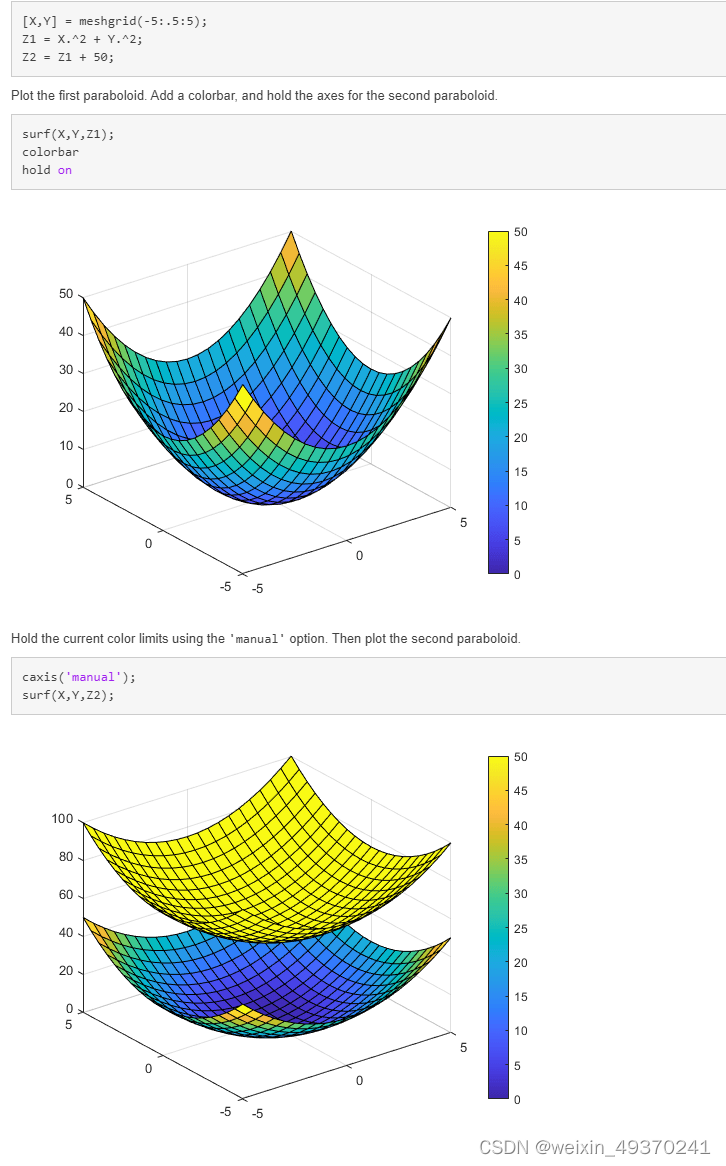
caxis用法三:为不同或特定的axes设置颜色限制范围Set Color Limits on a Specific Axes

三. colorbar 颜色条
cbar = colorbar
关键在于colorbar的几个属性,若对当前colorbarcb2不满意,可以用delete(cb2)删除,再重新设置colorbar

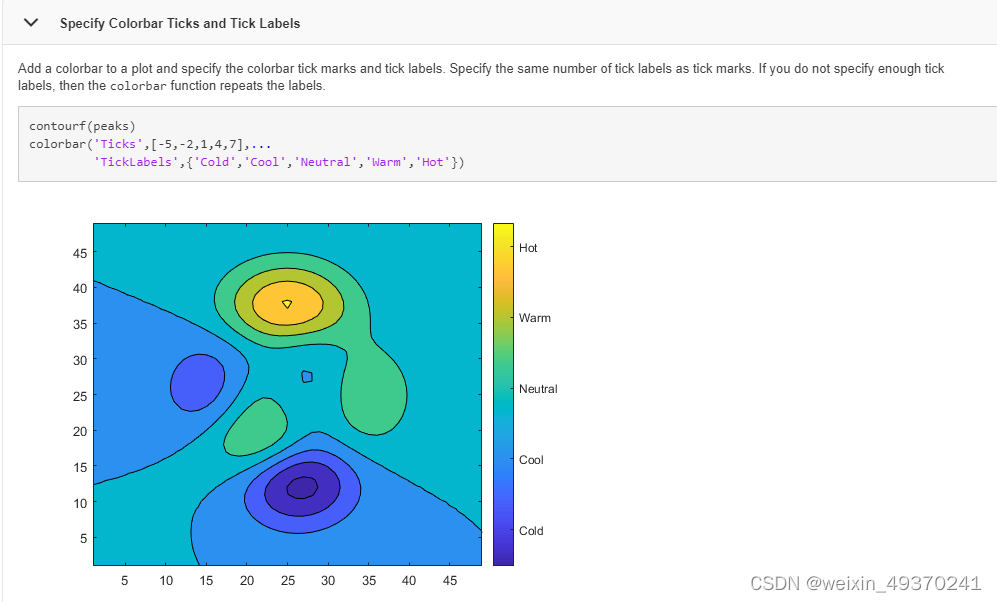
讯享网cbar = colorbar; cbar % 在MATLAB命令行输出colorbar的所有属性 cbar.Ticks cbar.TicksLabels cbar.TickLabelInterpreter % 此选项可指定latex选项, 用于特殊符号或数学公式 cbar.FontSize cbar.TickLength % 默认是0.01 cbar.TickDirection % tick 向内还是向外 delete(cbar) % 对当前cbar不满意,删除之后,可再用colorbar函数设置 colorbar('Ticks',[-5,-2,1,4,7],... 'TickLabels',{'Cold','Cool','Neutral','Warm','Hot'})

surf(peaks) c = colorbar; c.Label.String = 'Elevation (ft in 1000s)'; % 类似于colorbar的标题或坐标轴标识,类似于xlabel ylabel 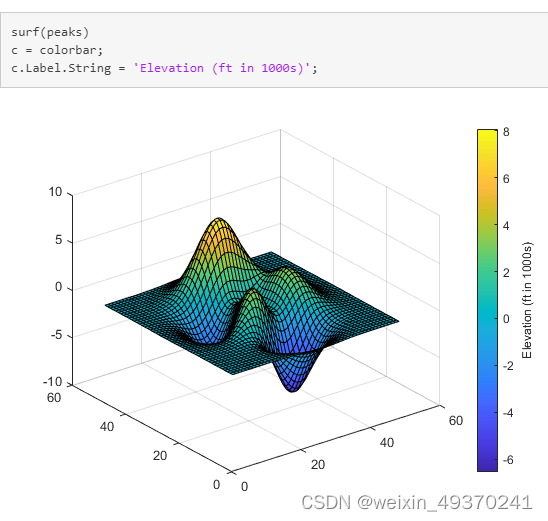
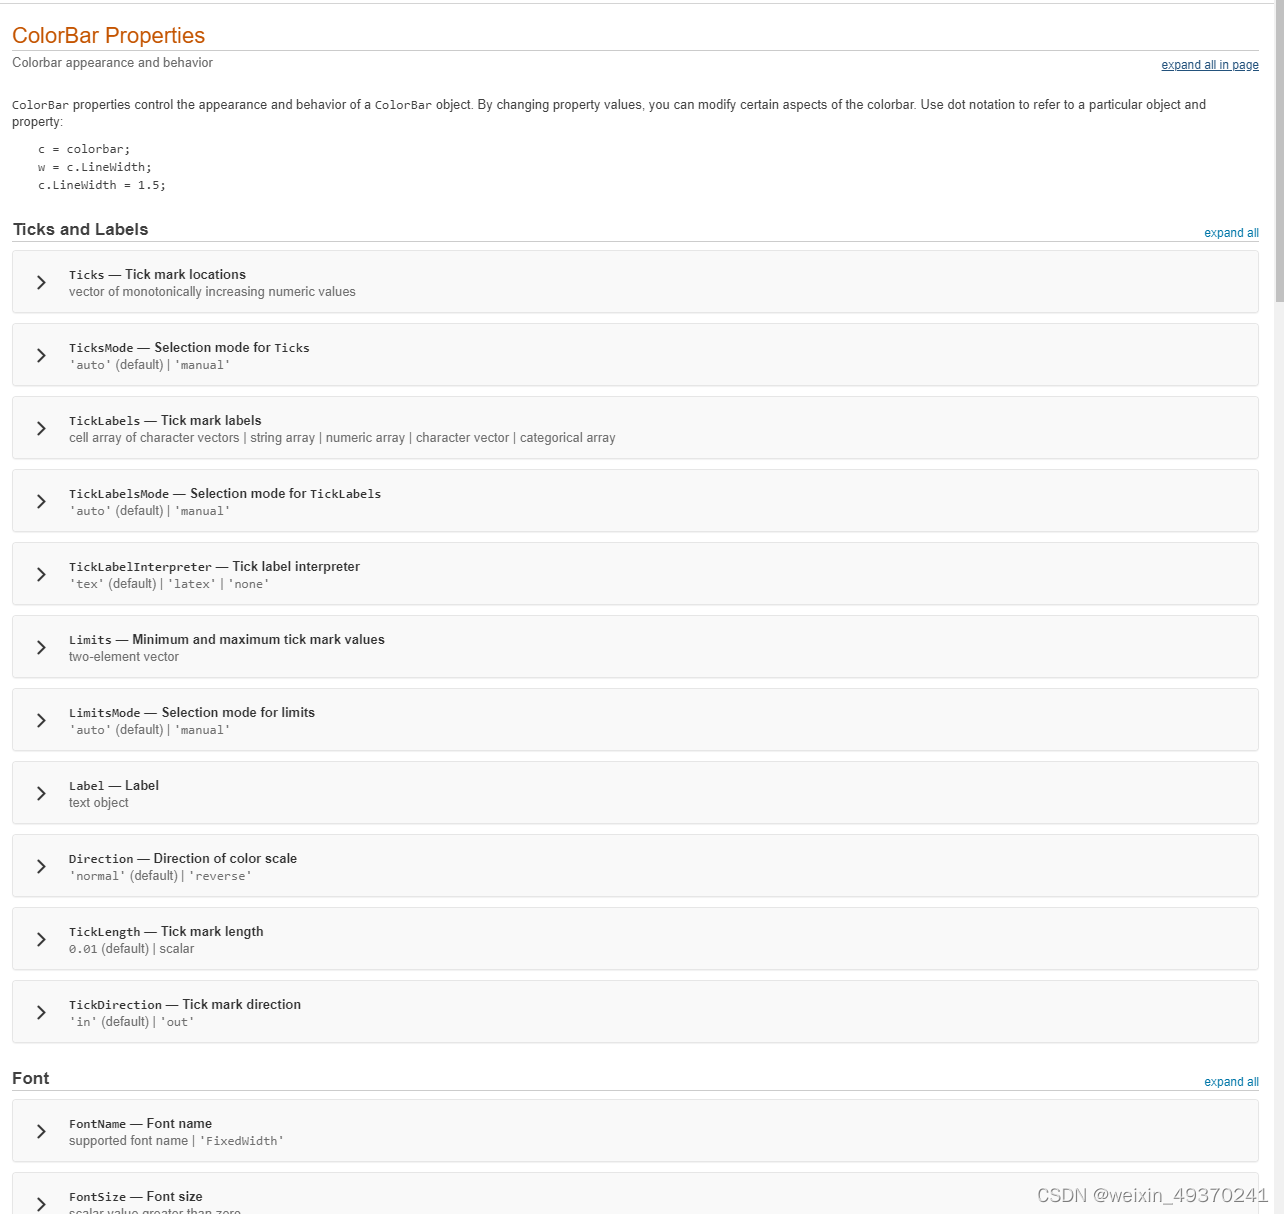
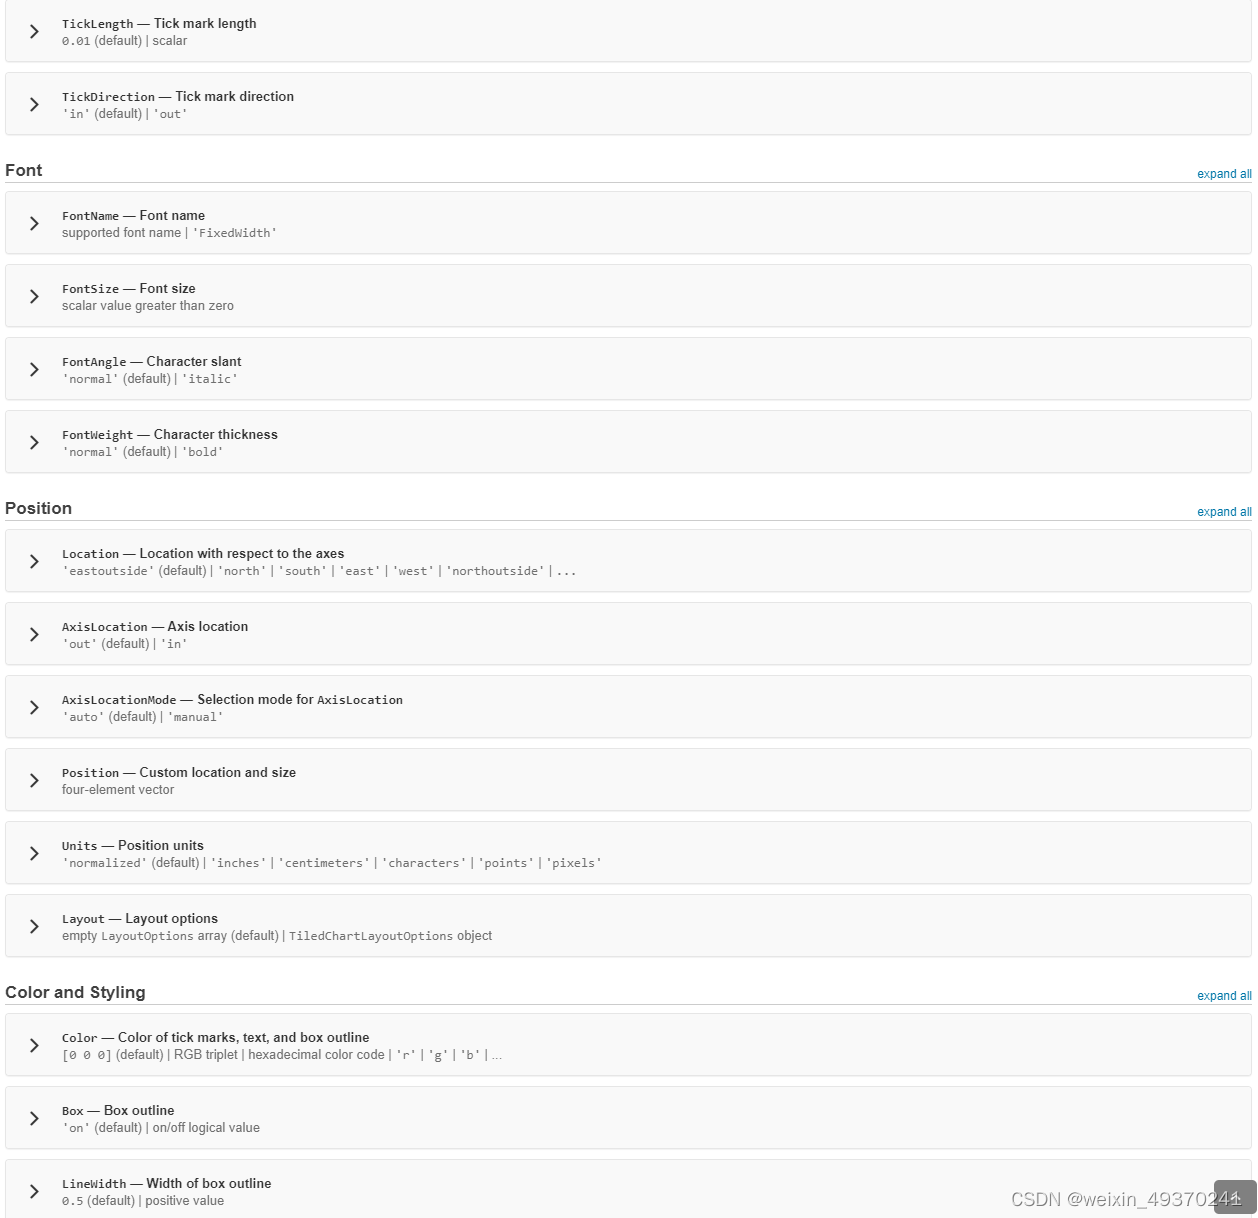
以下是colorbar的property选项
四. shading
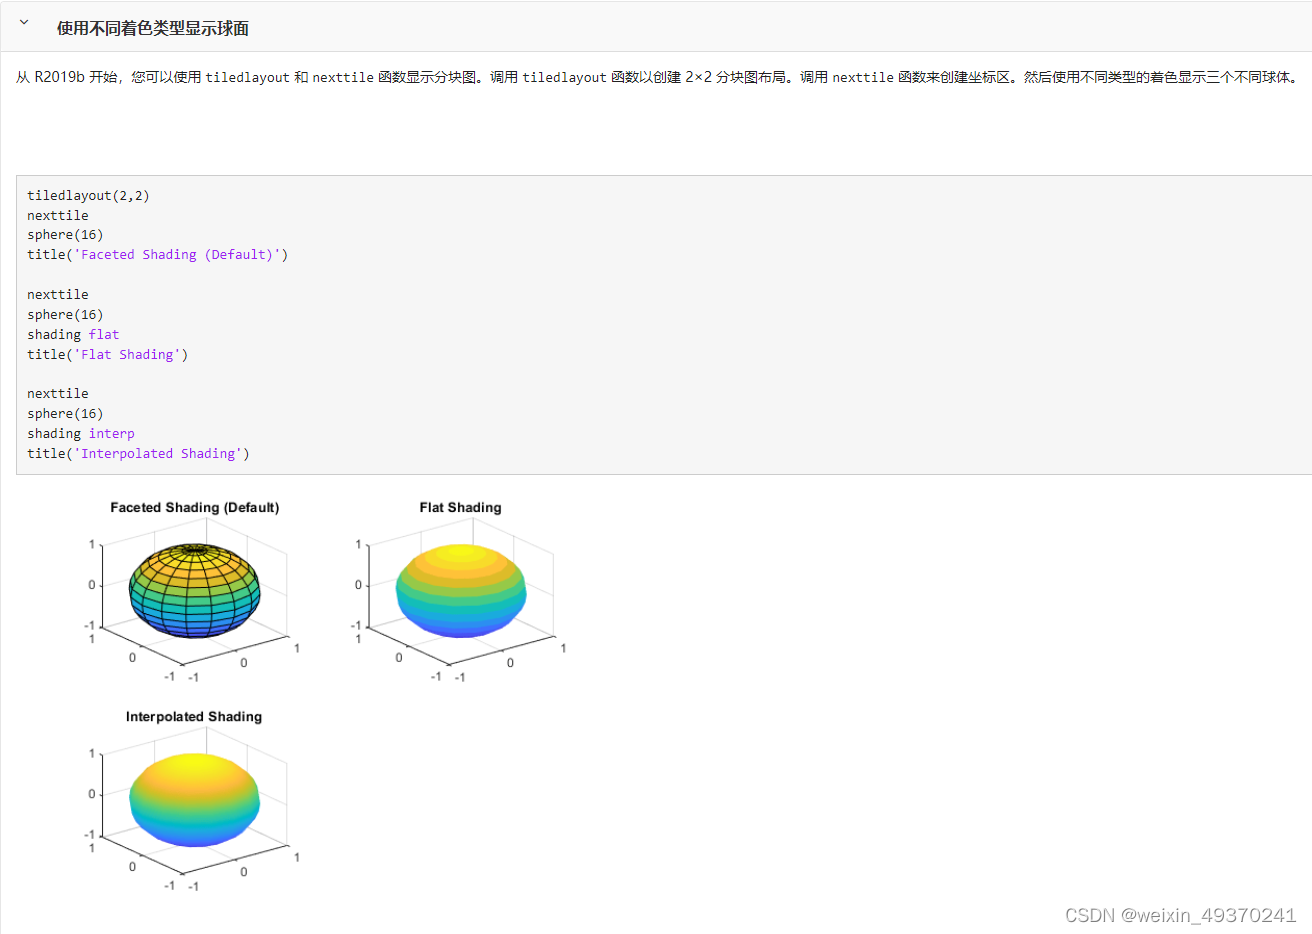
shading 函数:设置颜色着色属性 主要就是 flat facted interp 三个选项
讯享网shading flat shading faceted shading interp shading(axes_handle,...) shading 函数控制曲面和补片图形对象的颜色着色。 shading flat 每个网格线段和面具有恒定颜色,该颜色由该线段的端点或该面的角边处具有最小索引的颜色值确定。 shading faceted 具有叠加的黑色网格线的单一着色。这是默认的着色模式。 shading interp 通过在每个线条或面中对颜色图索引或真彩色值进行插值来改变该线条或面中的颜色。 shading(axes_handle,...) 将着色类型应用于 axes_handle 指定的坐标区而非当前坐标区中的对象。使用函数形式时,可以使用单引号。例如: shading(gca,'interp') % 以下是 shading 三个选项的效果。facted是默认选项 tiledlayout(2,2) nexttile sphere(16) title('Faceted Shading (Default)') nexttile sphere(16) shading flat title('Flat Shading') nexttile sphere(16) shading interp title('Interpolated Shading')
五. pcolor
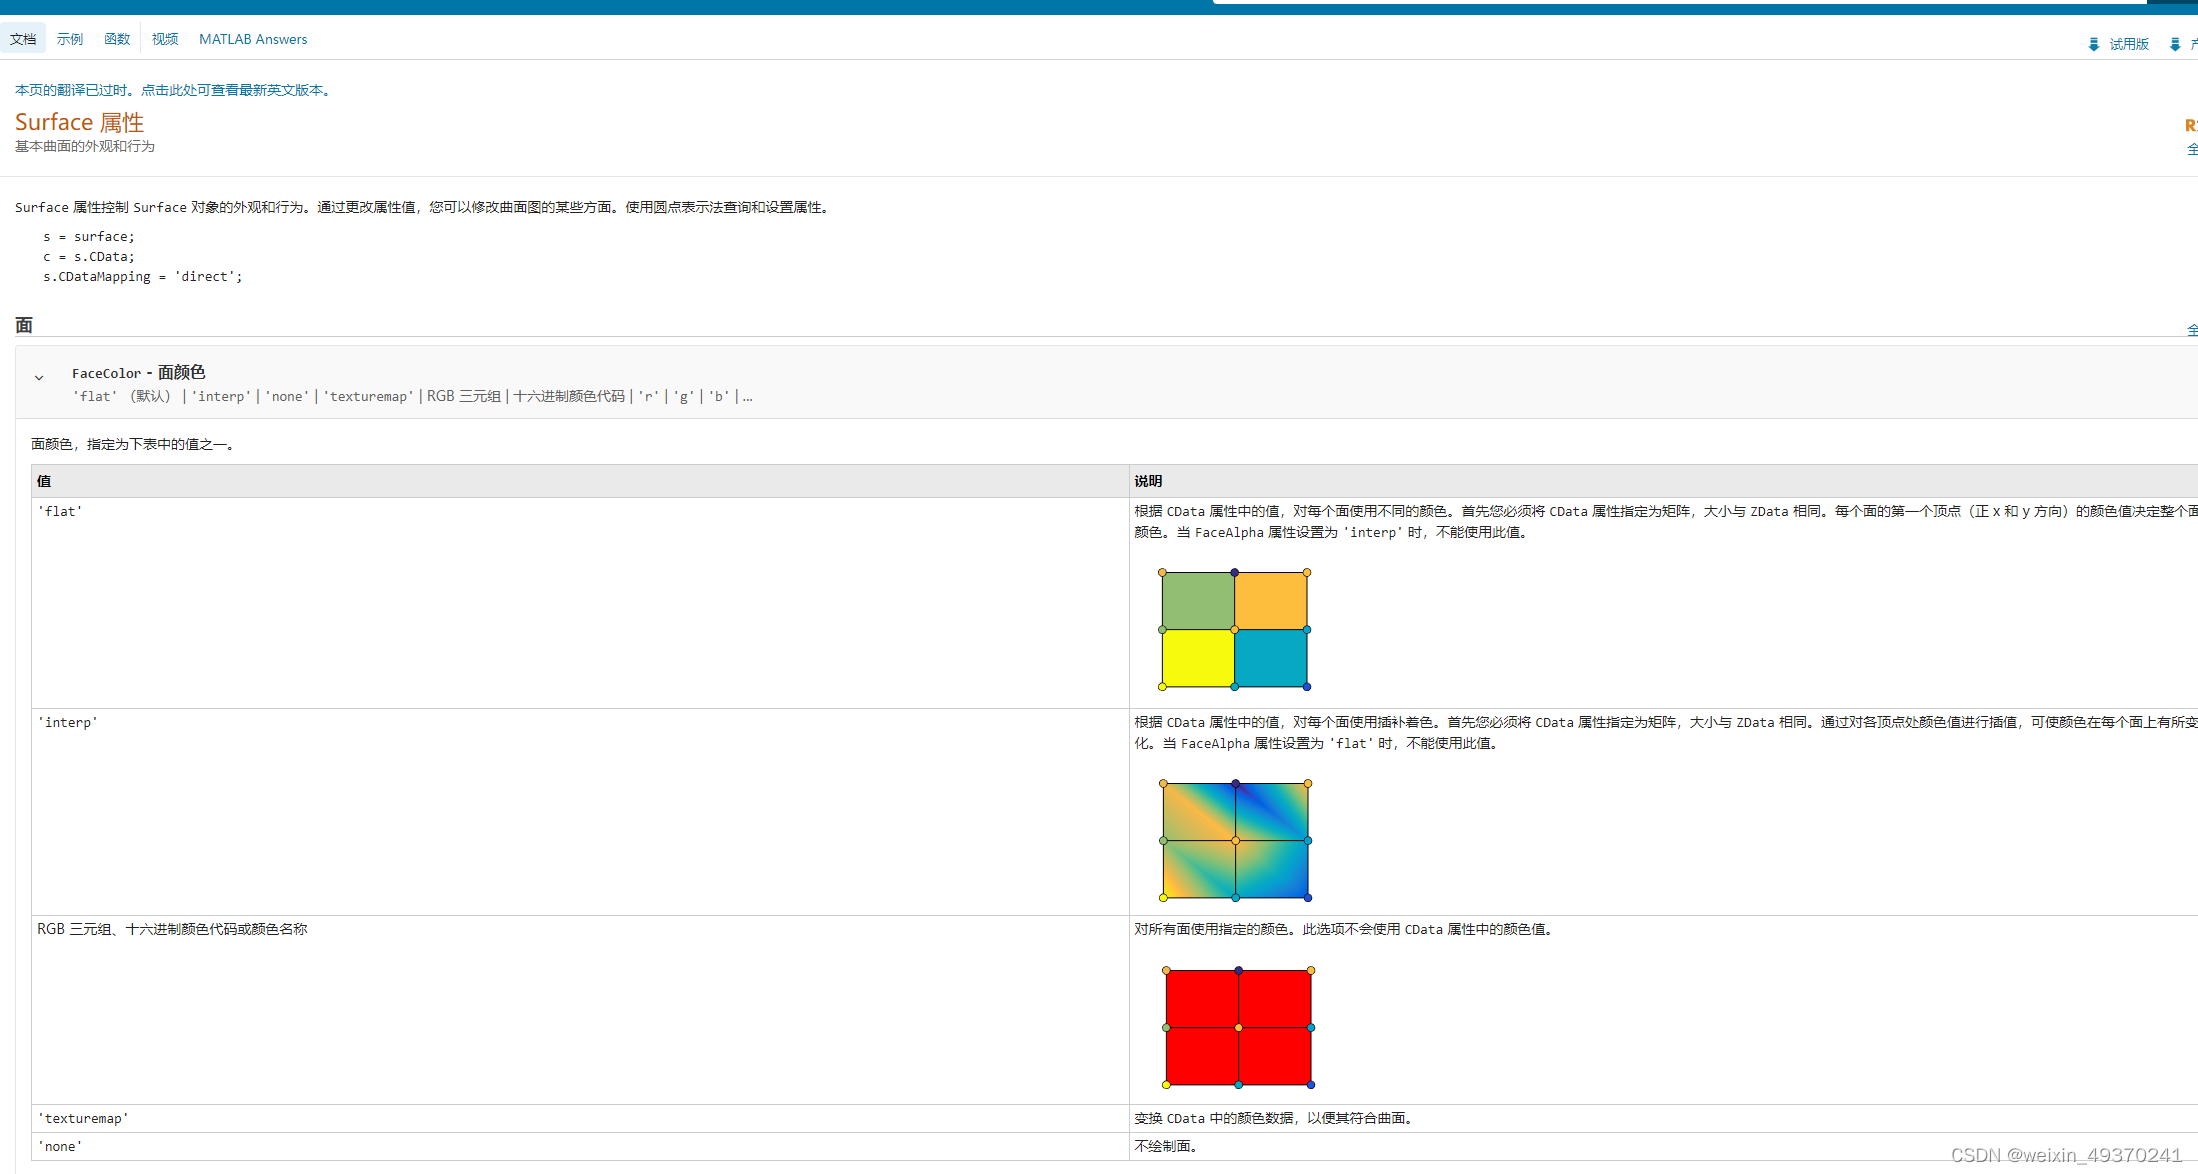
C = [1 2 3; 4 5 6; 7 8 9]; s = pcolor(C); % 通过设置 s 的 EdgeColor 属性来更改边框颜色。通过设置 LineWidth 属性使边框更粗。 s.EdgeColor = [1 0.7 0.3]; s.LineWidth = 6; s.EdgeColor = 'none'; % 不绘制边缘,这也是最常见的指定方法,特别是涉及的点很多的情况下 C = [5 13 9 7 12; 11 2 14 8 10; 6 1 3 4 15]; s = pcolor(C); s.FaceColor = 'interp'; % 要跨面进行颜色插值,请将 s 的 FaceColor 属性设置为 'interp'。 
pcolor的面颜色Facecolor选项为默认flat (同一个格子是相同的颜色);interp选项则是格点插值,跨格点的显示效果更好,特别是格点数目较少的情况下,不会出现像马赛克一样的情况 ,因此一般推荐使用 interp选项。
[根据 CData 属性中的值,对每个面使用插补着色。首先您必须将 CData 属性指定为矩阵,大小与 ZData 相同。通过对各顶点处颜色值进行插值,可使颜色在每个面上有所变化。]
版权声明:本文内容由互联网用户自发贡献,该文观点仅代表作者本人。本站仅提供信息存储空间服务,不拥有所有权,不承担相关法律责任。如发现本站有涉嫌侵权/违法违规的内容,请联系我们,一经查实,本站将立刻删除。
如需转载请保留出处:https://51itzy.com/kjqy/64506.html