
pprof是GoLang程序性能分析工具,prof是profile(画像)的缩写,用pprof我们可以分析下面9种数据
真正分析时常用4种
- CPU Profiling:CPU 分析,按照一定的频率采集所监听的应用程序 CPU(含寄存器)的使用情况,可确定应用程序在主动消耗 CPU 周期时花费时间的位置
- Memory Profiling:内存分析,在应用程序进行堆分配时记录堆栈跟踪,用于监视当前和历史内存使用情况,以及检查内存泄漏
- Block Profiling:阻塞分析,记录 goroutine 阻塞等待同步(包括定时器通道)的位置
- Mutex Profiling:互斥锁分析,报告互斥锁的竞争情况
做性能分析,第一步需要先获取数据,然后对数据进行分析。所以下面展示一下如何进行数据获取。
数据获取
数据获取的方法和应用的类型相关:
- 工具型应用:执行完任务就退出
- 服务型应用:一直运行,如web服务等
- 使用默认
ServerMux - 自定义
ServerMux - 开源web框架,如gin等
- grpc类服务
工具形应用
工具形应用主要使用 runtime/pprof 库,将画像数据写入文件中。
package main import ( "fmt" "os" "runtime/pprof" ) func main() { //CPU Profile f, err := os.Create("./cpuprofile") if err != nil { fmt.Println(err) return } defer f.Close() pprof.StartCPUProfile(f) defer pprof.StopCPUProfile() //Memory Profile fm, err := os.Create("./memoryprofile") if err != nil { fmt.Println(err) return } defer fm.Close() pprof.WriteHeapProfile(fm) for i := 0; i < 100; i++ { fmt.Println("程序员麻辣烫") } } 讯享网
执行完后,会发现cpuprofile、memoryprofile文件,里面包含cpu、内存的画像。 runtime/pprof 直接支持这两种画像。
服务型应用
使用默认ServerMux
这种是指使用了默认的 http.DefaultServeMux,通常是代码直接使用 http.ListenAndServe("0.0.0.0:8000", nil),第二个参数赋值为nil的情况。对于这种只需要在代码中添加一行,匿名引用net/http/pprof。
讯享网package main import ( "fmt" "net/http" _ "net/http/pprof" "strings" ) func sayhelloName(w http.ResponseWriter, r *http.Request) { r.ParseForm() //解析参数,默认是不会解析的 fmt.Println(r.Form) //这些信息是输出到服务器端的打印信息 fmt.Println("path", r.URL.Path) fmt.Println("scheme", r.URL.Scheme) fmt.Println(r.Form["url_long"]) for k, v := range r.Form { fmt.Println("key:", k) fmt.Println("val:", strings.Join(v, "")) } fmt.Fprintf(w, "Hello 程序员麻辣烫!") } func main() { http.HandleFunc("/", sayhelloName) //设置访问的路由 err := http.ListenAndServe(":9090", nil) //设置监听的端口 if err != nil { fmt.Printf("ListenAndServe: %s", err) } }
执行 http://localhost:9090/?url_long=111&url_long=222 可看到返回内容 “Hello 程序员麻辣烫!”。
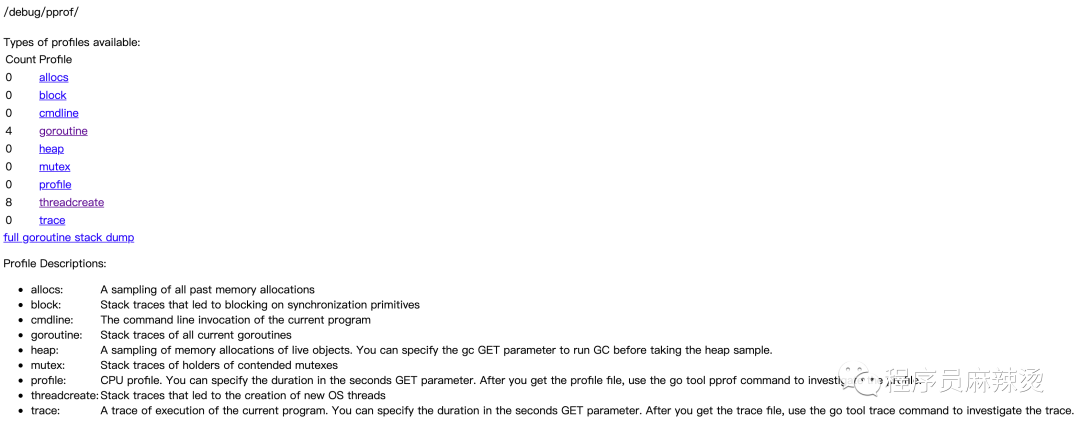
执行 http://localhost:9090/debug/pprof/ 可看到画像信息,如图一所示。
使用自定义的ServerMux
这里解释一下ServerMux,它是HTTP包中的一个结构体,里面存储了指定路径和该路径对应的处理函数
type ServeMux struct { mu sync.RWMutex m map[string]muxEntry es []muxEntry // slice of entries sorted from longest to shortest. hosts bool // whether any patterns contain hostnames } HTTP包中Server的hander默认就是DefaultServeMux
讯享网type Server struct { Addr string // TCP address to listen on, ":http" if empty Handler Handler // handler to invoke, http.DefaultServeMux if nil }
http.ListenAndServe函数可以传递handler,如果handler不为nil,则说明研发自定义了 ServerMux,否则用的是默认DefaultServeMux
// ListenAndServe always returns a non-nil error. func ListenAndServe(addr string, handler Handler) error { server := &Server{Addr: addr, Handler: handler} return server.ListenAndServe() } ListenAndServe最终会调用到ServeHTTP函数,根据路径找到对应的执行函数,整个流程结束
讯享网func (sh serverHandler) ServeHTTP(rw ResponseWriter, req *Request) { handler := sh.srv.Handler if handler == nil { handler = DefaultServeMux } if req.RequestURI == "*" && req.Method == "OPTIONS" { handler = globalOptionsHandler{} } handler.ServeHTTP(rw, req) }
net/http/pprof包中,有init函数
func init() { http.HandleFunc("/debug/pprof/", Index) http.HandleFunc("/debug/pprof/cmdline", Cmdline) http.HandleFunc("/debug/pprof/profile", Profile) http.HandleFunc("/debug/pprof/symbol", Symbol) http.HandleFunc("/debug/pprof/trace", Trace) } 所以如果使用默认ServerMux,则不需要注册,但是如果使用自定义的ServerMux,则需要增加注册后,才能获取到pprof。
讯享网r.HandleFunc("/debug/pprof/", pprof.Index) r.HandleFunc("/debug/pprof/cmdline", pprof.Cmdline) r.HandleFunc("/debug/pprof/profile", pprof.Profile) r.HandleFunc("/debug/pprof/symbol", pprof.Symbol) r.HandleFunc("/debug/pprof/trace", pprof.Trace)
这里就不编写代码了,因为自定义一个ServerMux虽然难度不大,但是还是有些耗时的。大家知道对这种情况如何添加pprof即可。
操作完成后,执行 http://localhost:9090/debug/pprof/ 可看到画像信息,如图一所示。
开源web框架
开源web框架很多,因为常用gin,此处就讲述一下如何在gin框架中使用pprof。
在gin中使用pprof比较简单:
- 直接引入
Gin项目组提供的gin-contrib/pprof包 - 调用pprof.Register®
package main import ( "github.com/gin-contrib/pprof" "github.com/gin-gonic/gin" "net/http" ) func Ping(c *gin.Context) { c.String(http.StatusOK, "ok") } func main() { r := gin.Default() pprof.Register(r) r.GET("/ping", Ping) // Listen and Server in 0.0.0.0:8080 r.Run(":8082") } 执行 http://localhost:8082/ping 可看到返回结果 “OK”
执行 http://localhost:8082/debug/pprof/ 可看到画像信息,如图一所示
之所以调用pprof.Register®后pprof相关路由可访问,是因为Register替我们做了路径注册的事情
讯享网// Register the standard HandlerFuncs from the net/http/pprof package with // the provided gin.Engine. prefixOptions is a optional. If not prefixOptions, // the default path prefix is used, otherwise first prefixOptions will be path prefix. func Register(r *gin.Engine, prefixOptions ...string) { RouteRegister(&(r.RouterGroup), prefixOptions...) } // RouteRegister the standard HandlerFuncs from the net/http/pprof package with // the provided gin.GrouterGroup. prefixOptions is a optional. If not prefixOptions, // the default path prefix is used, otherwise first prefixOptions will be path prefix. func RouteRegister(rg *gin.RouterGroup, prefixOptions ...string) { prefix := getPrefix(prefixOptions...) prefixRouter := rg.Group(prefix) { prefixRouter.GET("/", pprofHandler(pprof.Index)) prefixRouter.GET("/cmdline", pprofHandler(pprof.Cmdline)) prefixRouter.GET("/profile", pprofHandler(pprof.Profile)) prefixRouter.POST("/symbol", pprofHandler(pprof.Symbol)) prefixRouter.GET("/symbol", pprofHandler(pprof.Symbol)) prefixRouter.GET("/trace", pprofHandler(pprof.Trace)) prefixRouter.GET("/allocs", pprofHandler(pprof.Handler("allocs").ServeHTTP)) prefixRouter.GET("/block", pprofHandler(pprof.Handler("block").ServeHTTP)) prefixRouter.GET("/goroutine", pprofHandler(pprof.Handler("goroutine").ServeHTTP)) prefixRouter.GET("/heap", pprofHandler(pprof.Handler("heap").ServeHTTP)) prefixRouter.GET("/mutex", pprofHandler(pprof.Handler("mutex").ServeHTTP)) prefixRouter.GET("/threadcreate", pprofHandler(pprof.Handler("threadcreate").ServeHTTP)) } }
该项目地址为:https://github.com/shidawuhen/asap
grpc类服务
上面的几种服务型应用都能通过链接直接访问,如果是grpc这种类型的服务,如何使用pprof呢?
pprof做CPU分析原理是按照一定的频率采集程序CPU(包括寄存器)的使用情况,所以我们可以
- 在
gRPC服务启动时,异步启动一个监听其他端口的HTTP服务,通过这个HTTP服务间接获取gRPC服务的分析数据 - 因为gin使用默认的
ServerMux(服务复用器),所以只要匿名导入net/http/pprof包,这个HTTP的复用器默认就会注册pprof相关的路由
package main import ( "context" "log" "net" "net/http" "google.golang.org/grpc" pb "grpcservice/helloworld" _ "net/http/pprof" ) const ( port = ":50051" portpprof = ":50052" ) // server is used to implement helloworld.GreeterServer. type server struct { pb.UnimplementedGreeterServer } // SayHello implements helloworld.GreeterServer func (s *server) SayHello(ctx context.Context, in *pb.HelloRequest) (*pb.HelloReply, error) { log.Printf("Received: %v", in.GetName()) return &pb.HelloReply{Message: "Hello " + in.GetName()}, nil } func main() { //pprof go func() { http.ListenAndServe(portpprof, nil) }() lis, err := net.Listen("tcp", port) if err != nil { log.Fatalf("failed to listen: %v", err) } s := grpc.NewServer() pb.RegisterGreeterServer(s, &server{}) if err := s.Serve(lis); err != nil { log.Fatalf("failed to serve: %v", err) } } github地址为:https://github.com/shidawuhen/grpcservice (以前学习时的demo竟然用到新文章上,开心)
执行 http://localhost:50052/debug/pprof/ 可看到画像信息,如图一所示
PS:通过分析上面几种类型,可以看出对于服务型应用,核心在于将pprof的路由注册到服务中,并能提供访问。
数据分析
虽然我们生成了数据,这些数据可以存储到文件里、也可以展示在浏览器中。
但是直接访问这些性能分析数据,我们是分析不过来什么的。Go在1.11版本后在它自带的工具集go tool里内置了pprof工具来分析由pprof库生成的数据文件。
使用go tool pprof分析数据,主要有两种写法:
- 通过路径,如go tool pprof http://localhost:8082/debug/pprof/profile (进入命令行交互模式)
- 通过下载的文件,如go tool pprof cpuprofile (进入命令行交互模式)或者 go tool pprof -http=:9091 cpuprofile(进入web页面)
进入命令行交互模式后,可以使用help查看所有子命令,使用help <cmd|option>查看子命令使用方法。
讯享网(pprof) help Commands: callgrind Outputs a graph in callgrind format comments Output all profile comments
(pprof) help top Outputs top entries in text form Usage: top [n] [focus_regex]* [-ignore_regex]* [-cum] >f 具体选择哪种根据自己需要使用,本文都是用通过路径的方案进行分析,使用https://github.com/shidawuhen/asap中的代码。
CPU Profiling
先来看profile,访问/debug/pprof/profile这个链接会自动进行 CPU profiling,持续 30s,并生成一个文件供下载,可以通过带参数?=seconds=60进行60秒的数据采集。
为了模拟请求,使用ab进行压测,ab -k -c 1 -t 180 -n http://localhost:8082/limit/countreject
执行go tool pprof http://localhost:8082/debug/pprof/profile后,默认需要等30s才会显示交互
列出最耗时的地方
讯享网(pprof) top 20 Showing nodes accounting for 30.06s, 99.01% of 30.36s total Dropped 52 nodes (cum <= 0.15s) Showing top 20 nodes out of 78 flat flat% sum% cum cum% 8.74s 28.79% 28.79% 8.76s 28.85% syscall.syscall 5.99s 19.73% 48.52% 5.99s 19.73% runtime.pthread_cond_signal 4.46s 14.69% 63.21% 4.46s 14.69% runtime.pthread_cond_wait 3.25s 10.70% 73.91% 3.25s 10.70% runtime.kevent 2.25s 7.41% 81.32% 5.50s 18.12% runtime.netpoll 2s 6.59% 87.91% 2s 6.59% runtime.nanotime 1.44s 4.74% 92.65% 1.44s 4.74% runtime.usleep 0.68s 2.24% 94.89% 0.68s 2.24% runtime.pthread_cond_timedwait_relative_np 0.55s 1.81% 96.71% 1.23s 4.05% runtime.notetsleep 0.50s 1.65% 98.35% 0.67s 2.21% net/http.(*connReader).backgroundRead 0.11s 0.36% 98.72% 11.24s 37.02% runtime.findrunnable 0.04s 0.13% 98.85% 4.52s 14.89% runtime.stopm 0.03s 0.099% 98.95% 0.23s 0.76% runtime.runqgrab 0.02s 0.066% 99.01% 5.48s 18.05% internal/poll.(*FD).Write 0 0% 99.01% 2.84s 9.35% asap/aredis.(*RedisManager).Do 0 0% 99.01% 2.84s 9.35% asap/aredis.(*RedisManager).Incr 0 0% 99.01% 2.84s 9.35% asap/aredis.(*RedisManager).Incr.func1 0 0% 99.01% 2.84s 9.35% asap/aredis.(*RedisManager).redialDo 0 0% 99.01% 3.10s 10.21% asap/controller/limit.CountReject 0 0% 99.01% 1.50s 4.94% bufio.(*Reader).ReadLine
每一行表示一个函数的信息。
flat:函数在 CPU 上运行的时间
flat%:函数在CPU上运行时间的百分比
sum%:是从上到当前行所有函数累加使用 CPU 的比例,如第二行sum=48.52=28.79+19.73
cum:这个函数以及子函数运行所占用的时间,应该大于等于flat
cum%:这个函数以及子函数运行所占用的比例,应该大于等于flat%
最后一列:函数的名字
如果应用程序有性能问题,上面这些信息应该能告诉我们时间都花费在哪些函数的执行上。通过这些信息可以发现,redis操作所消耗的时间微乎其微。
生成函数调用图
在交互模式下输入 web,就能自动生成一个 svg 文件,并跳转到浏览器打开,生成了一个函数调用图,不过需要安装graphviz后才能使用,安装方法可参考 https://shidawuhen.github.io/2020/02/08/go-callvis/ 。
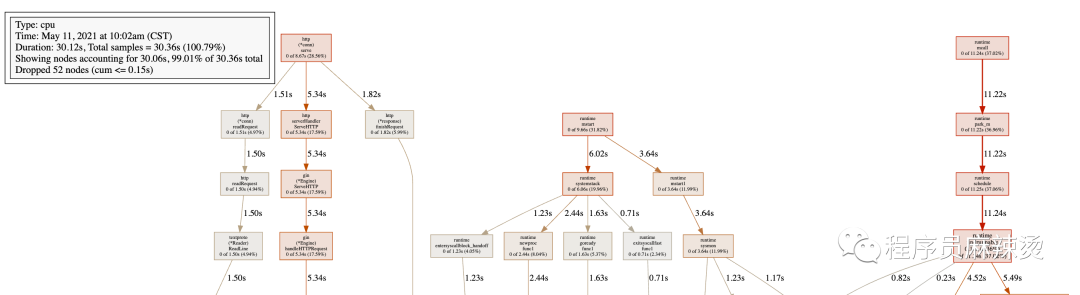
左上角方框内数据:表示显示的为cpu的画像。显示的节点在总共30.36s的抽样中,占30.06s,比例为99.01%。
图中每个方框对应应用程序运行的一个函数,方框越大代表函数执行的时间越久(函数执行时间会包含它调用的子函数的执行时间,但并不是正比的关系);方框之间的箭头代表着调用关系,箭头上的数字代表被调用函数的执行时间。具体细节可以参考:https://github.com/google/pprof/tree/master/doc#interpreting-the-callgraph
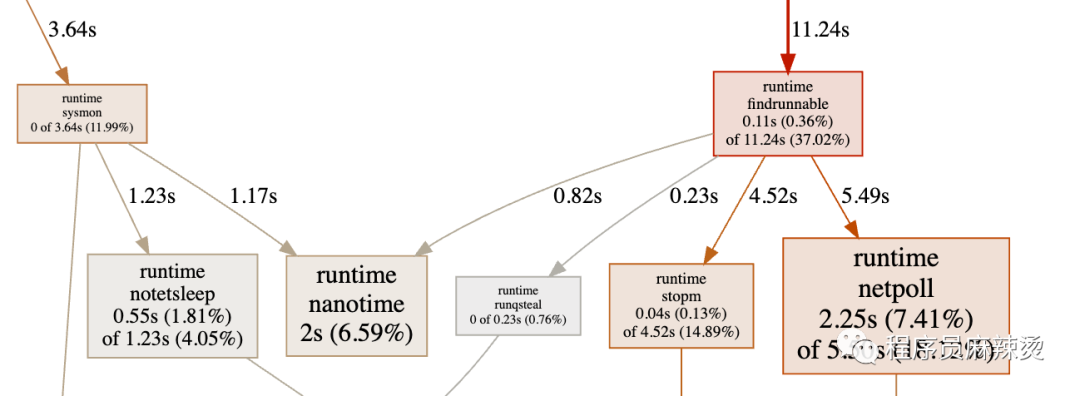
方框中显示的时间为总时间,findrunnable的总执行时间为11.24s,总时间占比为37.02%,只算函数自身执行时间为0.11s,总时间占比为0.36%=(0.11/11.24)*37.02%。调用函数5.49+4.52+0.23+0.82=11.06约等于11.24-0.11=11.13。
通过函数调用图,可以很直观的看出哪个函数耗时严重。
分析函数代码
当确定出哪个函数耗时之后,可以用pprof分析函数中的哪一行导致的耗时,使用子命令:list 函数名。
(pprof) list CountReject Total: 30.36s ROUTINE ======================== asap/controller/limit.CountReject in /Users/bytedance/My/work/code/go/asap/controller/limit/countReject.go 0 3.10s (flat, cum) 10.21% of Total . . 16:// @Router /limit/countreject [get] . . 17:func CountReject(c *gin.Context) { . . 18: currentTime := time.Now().Unix() . . 19: key := fmt.Sprintf("count:%d", currentTime) . . 20: limitCount := 5 . 250ms 21: fmt.Println(key) . 2.84s 22: trafficCount, _ := aredis.GetRedis(aredis.BASEREDIS).Incr(key) . . 23: if trafficCount == 1 { . . 24: aredis.GetRedis(aredis.BASEREDIS).Expire(key, 86400) . . 25: } . . 26: if int(trafficCount) > limitCount { . 10ms 27: c.String(http.StatusBadGateway, "reject") . . 28: return . . 29: } . . 30: c.String(http.StatusOK, "ok") . . 31:} 可以看出,对于CountReject函数,耗时的位置主要在第22行,请求Redis的操作。
Memory Profiling
memory profiling主要查看程序当前活动对象内存分配。使用方法和CPU Profiling一样,
执行go tool pprof http://localhost:8082/debug/pprof/heap
列出最耗内存的地方
仍然使用top命令,可以看出最耗内存的位置是:golang.org/x/net/webdav.(*memFile).Write
讯享网(pprof) top 20 Showing nodes accounting for 16250.09kB, 100% of 16250.09kB total flat flat% sum% cum cum% 14704.35kB 90.49% 90.49% 14704.35kB 90.49% golang.org/x/net/webdav.(*memFile).Write 1024.38kB 6.30% 96.79% 1024.38kB 6.30% runtime.malg 521.37kB 3.21% 100% 521.37kB 3.21% golang.org/x/net/webdav/internal/xml.init 0 0% 100% 2154.28kB 13.26% github.com/swaggo/gin-swagger/swaggerFiles.init.12 0 0% 100% 1574.07kB 9.69% github.com/swaggo/gin-swagger/swaggerFiles.init.5 0 0% 100% 10976kB 67.54% github.com/swaggo/gin-swagger/swaggerFiles.init.6 0 0% 100% 15225.72kB 93.70% runtime.doInit 0 0% 100% 15225.72kB 93.70% runtime.main 0 0% 100% 1024.38kB 6.30% runtime.mstart 0 0% 100% 1024.38kB 6.30% runtime.newproc.func1 0 0% 100% 1024.38kB 6.30% runtime.newproc1 0 0% 100% 1024.38kB 6.30% runtime.systemstack
每一列的含义和CPU Profiling中表达的一致,只不过这里显示的是内存。
生成函数调用图
使用web命名,能够生成函数调用图,只不过显示的内容为内存维度
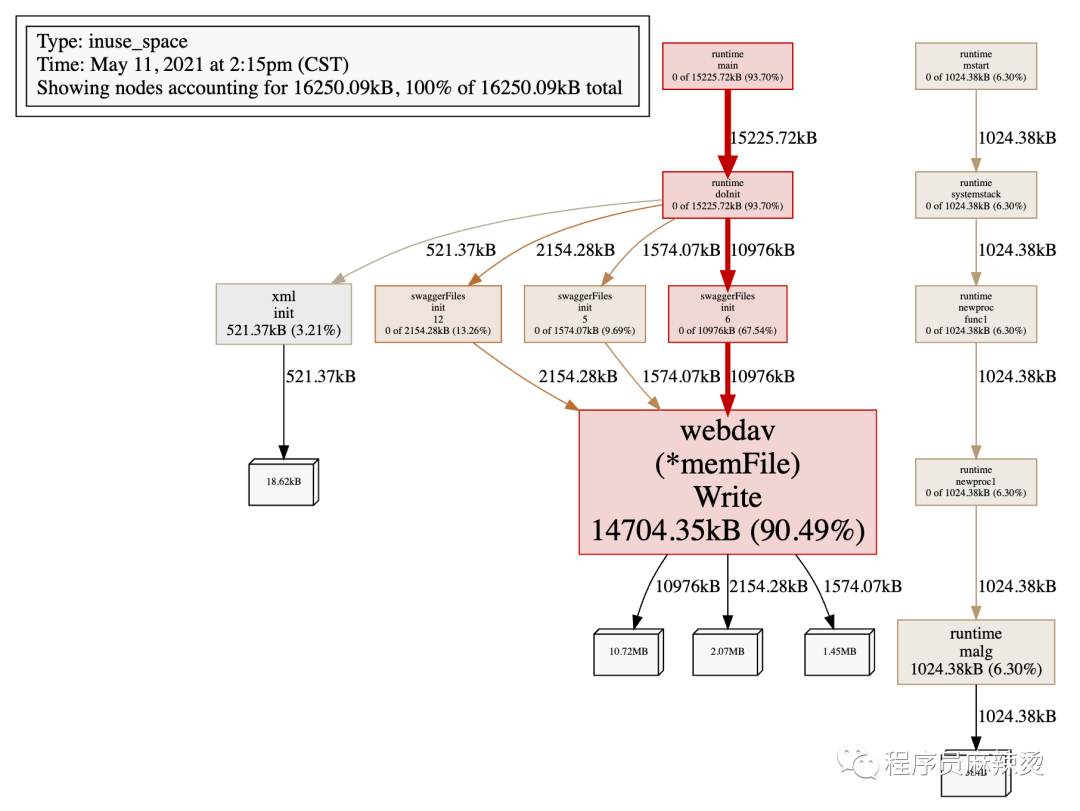
在这个代码里,我使用了swagger,在所有环境里都是打开的,所以看一下这个消耗可以发现生产环境确实是没必要开,浪费空间。
分析函数代码
仍然使用list 函数名,如list runtime.malg
(pprof) list runtime.malg Total: 15.87MB ROUTINE ======================== runtime.malg in /usr/local/go/src/runtime/proc.go 1MB 1MB (flat, cum) 6.30% of Total . . 3227: execLock.unlock() . . 3228:} . . 3229: . . 3230:// Allocate a new g, with a stack big enough for stacksize bytes. . . 3231:func malg(stacksize int32) *g { 1MB 1MB 3232: newg := new(g) . . 3233: if stacksize >= 0 { . . 3234: stacksize = round2(_StackSystem + stacksize) . . 3235: systemstack(func() { . . 3236: newg.stack = stackalloc(uint32(stacksize)) . . 3237: }) 可以看到内存主要消耗的位置。
数据分析总结
使用profile可以获取很多重要信息,cpu profiling、memory profiling使用也是最频繁的。分析的时候,需要先获取到数据,通过web发现耗时的函数,然后通过list找到具体位置。
其它的数据的分析和CPU、Memory基本一致。下面列一下所有的数据类型:
- http://localhost:8082/debug/pprof/ :获取概况信息,即图一的信息
- go tool pprof http://localhost:8082/debug/pprof/allocs : 分析内存分配
- go tool pprof http://localhost:8082/debug/pprof/block : 分析堆栈跟踪导致阻塞的同步原语
- go tool pprof http://localhost:8082/debug/pprof/cmdline : 分析命令行调用的程序,web下调用报错
- go tool pprof http://localhost:8082/debug/pprof/goroutine : 分析当前 goroutine 的堆栈信息
- go tool pprof http://localhost:8082/debug/pprof/heap : 分析当前活动对象内存分配
- go tool pprof http://localhost:8082/debug/pprof/mutex : 分析堆栈跟踪竞争状态互斥锁的持有者
- go tool pprof http://localhost:8082/debug/pprof/profile : 分析一定持续时间内CPU的使用情况
- go tool pprof http://localhost:8082/debug/pprof/threadcreate : 分析堆栈跟踪系统新线程的创建
- go tool pprof http://localhost:8082/debug/pprof/trace : 分析追踪当前程序的执行状况
总结
希望大家在生产环境中不会用到pprof,正常情况下,大部分问题都不需要用到pprof即可解决。使用pprof是有一定成本的,必须要想办法先能获取到数据。

如果真的遇到线上问题必须使用pprof,建议先想好要分析哪类数据。
pprof对程序的性能优化还是很有利的,获取数据后,可以快速定位到耗时较多的位置进行优化,而且也支持只打印和某个函数相关的命令,很人性化。
资料
- https: //studygolang.com/articles/26918#reply0
- Golang程序性能分析(一)pprof和go-torch
- Golang程序性能分析(二)在Echo和Gin框架中使用pprof
- Golang程序性能分析(三)用pprof分析gRPC服务的性能
- Golang 大杀器之性能剖析 PProf https://segmentfault.com/a/12013
- http://docscn.studygolang.com/pkg/runtime/pprof/
- https://github.com/google/pprof/blob/master/doc/README.md
- https://github.com/google/pprof/tree/master/doc
- pprof的使用 https://www.jianshu.com/p/fd
- 手把手教你使用pprof分析web项目(Golang)https://www.yuque.com/u/wtxoi6/ny150b
最后
大家如果喜欢我的文章,可以关注我的公众号(程序员麻辣烫)
我的个人博客为:https://shidawuhen.github.io/

往期文章回顾:
招聘
- 字节跳动|抖音电商急招上海前端开发工程
- 字节跳动|抖音电商上海资深服务端开发工程师-交易
- 字节跳动|抖音电商武汉服务端(高级)开发工程师
- 字节跳动|飞书大客户产品经理内推咯
- 字节跳动|抖音电商服务端技术岗位虚位以待
- 字节跳动招聘专题
设计模式
- Go设计模式(10)-原型模式
- Go设计模式(9)-建造者模式
- Go设计模式(8)-抽象工厂
- Go设计模式(7)-工厂模式
- Go设计模式(6)-单例模式
- Go设计模式(5)-类图符号表示法
- Go设计模式(4)-代码编写优化
- Go设计模式(4)-代码编写
- Go设计模式(3)-设计原则
- Go设计模式(2)-面向对象分析与设计
- Go设计模式(1)-语法
语言
- Go工具之generate
- Go单例实现方案
- Go通道实现原理
- Go定时器实现原理
- Beego框架使用
- Golang源码BUG追查
- Gin框架简洁版
- Gin源码剖析
架构
- 支付接入常规问题
- 限流实现2
- 秒杀系统
- 分布式系统与一致性协议
- 微服务之服务框架和注册中心
- 浅谈微服务
- 限流实现1
- CDN请求过程详解
- 常用缓存技巧
- 如何高效对接第三方支付
- 算法总结
存储
- MySQL开发规范
- Redis实现分布式锁
- 事务原子性、一致性、持久性的实现原理
- InnoDB锁与事务简析
网络
- HTTP2.0基础教程
- HTTPS配置实战
- HTTPS连接过程
- TCP性能优化
工具
- GoLand实用技巧
- 根据mysql表自动生成go struct
- Markdown编辑器推荐-typora
读书笔记
- 《毛选》推荐
- 原则
- 资治通鉴
- 敏捷革命
- 如何锻炼自己的记忆力
- 简单的逻辑学-读后感
- 热风-读后感
- 论语-读后感
- 孙子兵法-读后感
思考
- 为动员一切力量争取胜利而斗争
- 反对自由主义
- 实践论
- 评价自己的标准
- 服务端团队假期值班方案
- 项目流程管理
- 对项目管理的一些看法
- 对产品经理的一些思考
- 关于程序员职业发展的思考
- 关于代码review的思考
版权声明:本文内容由互联网用户自发贡献,该文观点仅代表作者本人。本站仅提供信息存储空间服务,不拥有所有权,不承担相关法律责任。如发现本站有涉嫌侵权/违法违规的内容,请联系我们,一经查实,本站将立刻删除。
如需转载请保留出处:https://51itzy.com/kjqy/48320.html