
夜莺监控搭建V6.0
夜莺监控介绍
官网:https://flashcat.cloud/ GitHub:https://github.com/ccfos/nightingale #夜莺( Nightingale )是一款国产开源、云原生监控系统,Nightingale 在 2020.3.20 发布 v1 版本,目前是 v6 版本,从这个版本开始,与 Prometheus、VictoriaMetrics、Grafana、Telegraf、Datadog 等生态做了协同集成,力争打造国内最好用的开源运维监控系统。出自 Open-Falcon 研发团队。 讯享网
架构图
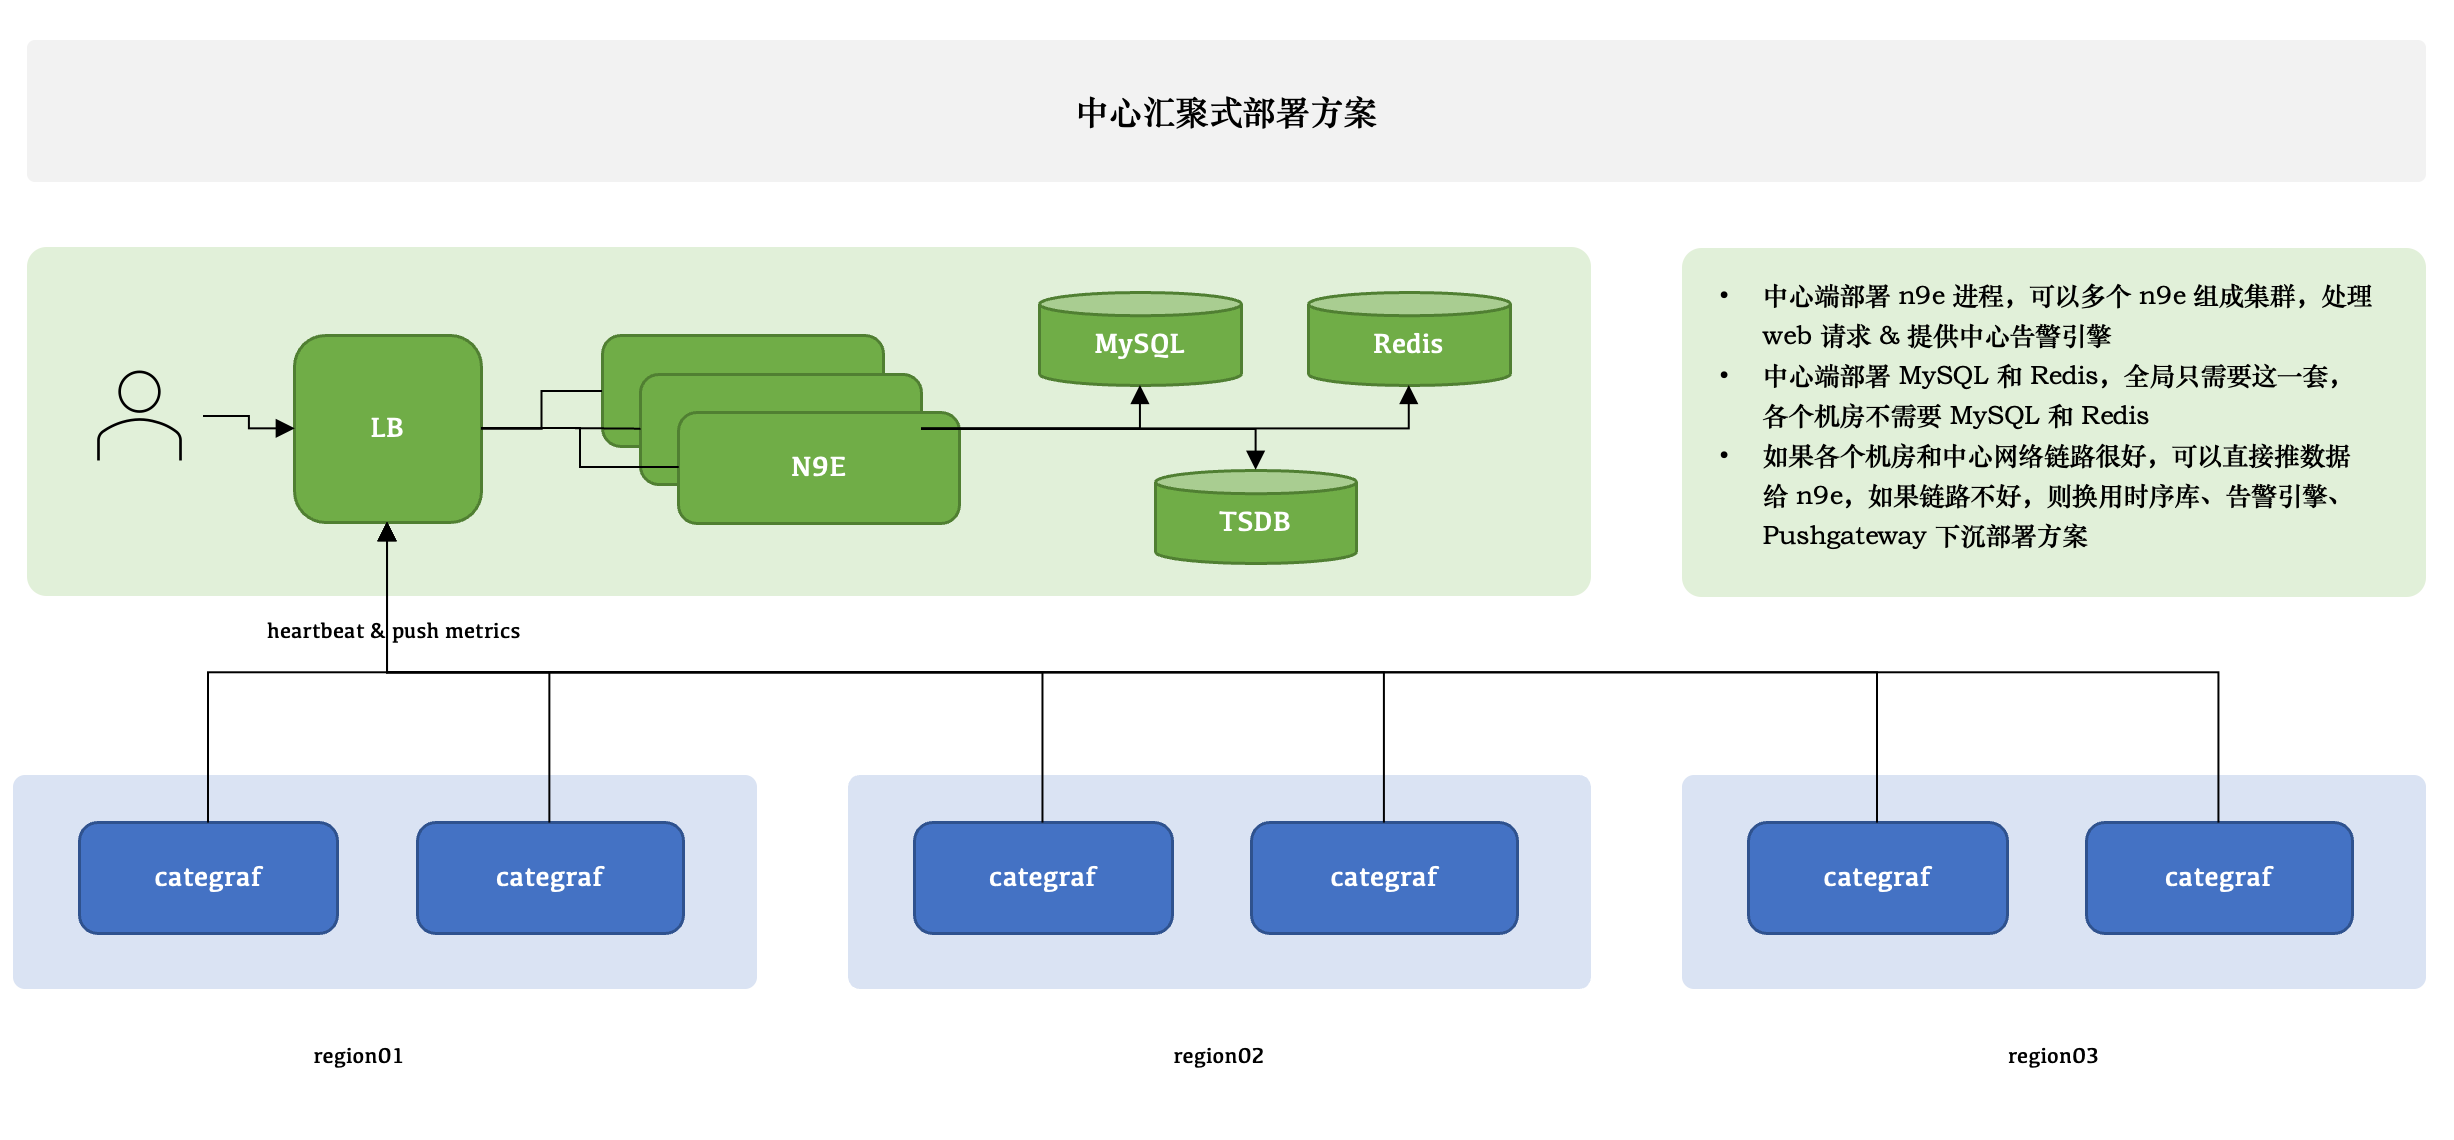
讯享网1.自己画的架构图。方便理解 #多的不说,少的不唠!大家自己去官网看文档。下面进行部署!!!
1.1 软件包安装
[root@aly ~]# mkdir -p /opt/prometheus #创建普罗米修斯的运行目录 [root@aly ~]# wget https://github.com/prometheus/prometheus/releases/download/v2.43.0/prometheus-2.43.0.linux-amd64.tar.gz -O prometheus-2.43.0.linux-amd64.tar.gz #获取普罗米修细的二进制包 [root@aly ~]# tar xf prometheus-2.43.0.linux-amd64.tar.gz #解压 [root@aly ~]# cp -far prometheus-2.43.0.linux-amd64/* /opt/prometheus/ 1.2 启动普罗米修斯时序库
讯享网[root@aly ~]# cat <<EOF >/etc/systemd/system/prometheus.service [Unit] Description="prometheus" Documentation=https://prometheus.io/ After=network.target [Service] Type=simple ExecStart=/opt/prometheus/prometheus --config.file=/opt/prometheus/prometheus.yml --storage.tsdb.path=/opt/prometheus/data --web.enable-lifecycle --enable-feature=remote-write-receiver --query.lookback-delta=2m Restart=on-failure SuccessExitStatus=0 LimitNOFILE=65536 StandardOutput=syslog StandardError=syslog SyslogIdentifier=prometheus [Install] WantedBy=multi-user.target EOF [root@aly ~]# systemctl daemon-reload # 加载新的unit 配置文件 [root@aly ~]# systemctl enable prometheus [root@aly ~]# systemctl restart prometheus
1.2 依赖软件安装
1.mysql安装 #自己本地存在mysql可以不安装!!mysql5.7以上即可! [root@aly ~]# yum -y install mariadb* [root@aly ~]# systemctl enable --now mariadb # 密码修改,可以修改为其它密码 mysql -e "SET PASSWORD FOR 'root'@'localhost' = PASSWORD('1234');" #如果密码安全策略不满足可以调整策略 set global validate_password_policy=LOW; #密码验证等级 set global validate_password_length=6; #密码长度 2.redis安装 [root@aly ~]# yum -y install redis [root@aly ~]# systemctl enable --now redis 1.3 安装夜莺
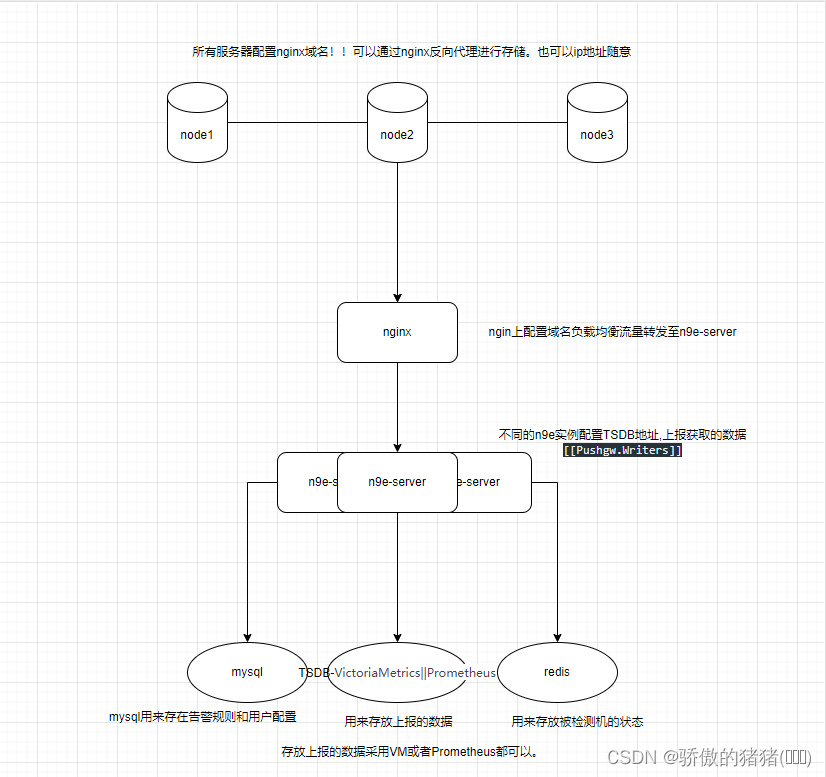
讯享网[root@aly ~]# mkdir -p /opt/n9e && cd /opt/n9e [root@aly n9e]# wget https://download.flashcat.cloud/n9e-v6.0.0-ga.3-linux-amd64.tar.gz #https://github.com/ccfos/nightingale/releases github的地址 [root@aly n9e]# tar -xvf n9e-v6.0.0-ga.3-linux-amd64.tar.gz [root@aly n9e]# mysql -uroot -p <n9e.sql #sql语句中有创建库 [root@aly n9e]# [Redis] # address, ip:port or ip1:port,ip2:port for cluster and sentinel(SentinelAddrs) Address = "127.0.0.1:6379" [DB] # postgres: host=%s port=%s user=%s dbname=%s password=%s sslmode=%s DSN="root:@tcp(127.0.0.1:3306)/n9e_v6?charset=utf8mb4&parseTime=True&loc=Local&allowNativePasswords=true" #默认DB的密码是1234需要修改为自己的数据库密码. [[Pushgw.Writers]] # Url = "http://127.0.0.1:8480/insert/0/prometheus/api/v1/write" Url = "http://127.0.0.1:9090/api/v1/write" #pushgw选择Prometheus # Basic auth username BasicAuthUser = "" # Basic auth password BasicAuthPass = "" # timeout settings, unit: ms Headers = ["X-From", "n9e"] Timeout = 10000 DialTimeout = 3000 TLSHandshakeTimeout = 30000 ExpectContinueTimeout = 1000 IdleConnTimeout = 90000 # time duration, unit: ms KeepAlive = 30000 MaxConnsPerHost = 0 MaxIdleConns = 100 MaxIdleConnsPerHost = 100 [root@aly n9e]# cat <<EOF >/etc/systemd/system/n9e.service [Unit] Description="n9e.service" After=network.target [Service] Type=simple ExecStart=/opt/n9e/n9e server WorkingDirectory=/opt/n9e Restart=on-failure SuccessExitStatus=0 LimitNOFILE=65536 StandardOutput=syslog StandardError=syslog SyslogIdentifier=n9e.service [Install] WantedBy=multi-user.target EOF [root@aly n9e]# systemctl daemon-reload [root@aly n9e]# systemctl enable --now n9e.service #下图为根据业务所画的集群版本的监控图 架构叙述: agent端安装categraf采集器,配置文件中编写nginx的域名->nginx中配置反向代理+负载均衡将流量转发给n9e-server->n9e-server暴漏17000端口将请求接收后转发给配置文件Pushg.writers的时序库vminsert:8428端口将数据进行存储!
1.3.1 安装时序库VM(可选)
#下面是官方所述的一些特点 VictoriaMetrics 架构简单,可靠性高,在性能,成本,可扩展性方面表现出色,社区活跃,且和 Prometheus 生态绑定紧密。如果单机版本的 Prometheus 无法在容量上满足贵司的需求,可以使用 VictoriaMetrics 作为时序数据库。 VictoriaMetrics 提供单机版和集群版。如果您的每秒写入数据点数小于100万(这个数量是个什么概念呢,如果只是做机器设备的监控,每个机器差不多采集200个指标,采集频率是10秒的话每台机器每秒采集20个指标左右,100万/20=5万台机器),VictoriaMetrics 官方默认推荐您使用单机版,单机版可以通过增加服务器的CPU核心数,增加内存,增加IOPS来获得线性的性能提升。且单机版易于配置和运维, 它可以用作普罗米修斯的长期储存。 它可以用作 Grafana中Prometheus 的直接替代品,因为它支持 Prometheus 查询 API。 它可以用作Grafana中Graphite的直接替代品,因为它支持Graphite API。与Graphite相比,VictoriaMetrics允许将基础设施成本降低10倍以上 - 请参阅此案例研究。 易于设置和操作: VictoriaMetrics由一个没有外部依赖关系的小可执行文件组成。 所有配置都是通过具有合理默认值的显式命令行标志完成的。 所有数据存储在命令行标志指向的单个目录中。-storageDataPath 使用vmbackup/vmrestore工具可以轻松快速地从即时快照进行备份。有关更多详细信息,请参阅此文章。 它实现了类似 PromQL 的查询语言 - MetricsQL,它在 PromQL 之上提供了改进的功能。 它提供全局查询视图。多个 Prometheus 实例或任何其他数据源可能会将数据摄取到 VictoriaMetrics 中。稍后可以通过单个查询查询此数据。 它为数据引入和数据查询提供了高性能以及良好的垂直和水平可扩展性。它的性能比InfluxDB和TimescaleDB高出20倍。 在处理数百万个独特的时间序列(又称高基数)时,它使用的 RAM 比 InfluxDB 少 10 倍,比普罗米修斯、灭霸或 Cortex 少 7 倍。 可以说VictoriaMetrics是企业版的普罗米修斯。 安装步骤 !!!!!!如果按照上方采用了Prometheus那么就可以不用VM。vm需要集群版功能才比较齐全。单机版没有报警没啥子意义!!! 1.[root@flshcat-server opt]# mkdir /opt/vm 2.[root@flshcat-server opt]# cd vm/ 3.[root@flshcat-server vm]# wget https://github.com/VictoriaMetrics/VictoriaMetrics/releases/download/v1.90.0/victoria-metrics-linux-amd64-v1.90.0.tar.gz 4.[root@flshcat-server vm]# tar -xvf victoria-metrics-linux-amd64-v1.90.0.tar.gz 5.[root@flshcat-server vm]# ls #单节点只有一个prod victoria-metrics-linux-amd64-v1.90.0.tar.gz victoria-metrics-prod 6.[root@flshcat-server vm]# cat <<EOF >/etc/systemd/system/victoria.service [Unit] Description="VictoriaMetrics" Documentation=https://docs.victoriametrics.com/ After=network.target [Service] Type=simple ExecStart=/opt/vm/victoria-metrics-prod Restart=on-failure SuccessExitStatus=0 LimitNOFILE=65536 StandardOutput=syslog StandardError=syslog SyslogIdentifier=victoria-metrics [Install] WantedBy=multi-user.target EOF 7.[root@flshcat-server vm]# systemctl daemon-reload 8.[root@flshcat-server vm]# systemctl enable --now victoria.service 9.[root@flshcat-server vm]# ss -anot | grep "8428" #监听在8428端口 LISTEN 0 128 *:8428 *:* users:(("victoria-metric",pid=21095,fd=10)) 1.3.2 VM时序库修改n9e配置
讯享网#因为是测试阶段所以普罗米修斯时序库和vm时序库一起用!! [[Pushgw.Writers]] # Url = "http://127.0.0.1:8480/insert/0/prometheus/api/v1/write" Url = "http://127.0.0.1:9090/api/v1/write" # Basic auth username BasicAuthUser = "" # Basic auth password BasicAuthPass = "" # timeout settings, unit: ms Headers = ["X-From", "n9e"] Timeout = 10000 DialTimeout = 3000 TLSHandshakeTimeout = 30000 ExpectContinueTimeout = 1000 IdleConnTimeout = 90000 # time duration, unit: ms KeepAlive = 30000 MaxConnsPerHost = 0 MaxIdleConns = 100 MaxIdleConnsPerHost = 100 Optional TLS Config # UseTLS = false # TLSCA = "/etc/n9e/ca.pem" # TLSCert = "/etc/n9e/cert.pem" # TLSKey = "/etc/n9e/key.pem" # InsecureSkipVerify = false # [[Writers.WriteRelabels]] # Action = "replace" # SourceLabels = ["__address__"] # Regex = "([^:]+)(?::\\d+)?" # Replacement = "$1:80" # TargetLabel = "__address__" # [[Pushgw.Writers]] # Url = "http://127.0.0.1:8480/insert/0/prometheus/api/v1/write" # Url = "http://127.0.0.1:9090/api/v1/write" Url = "http://127.0.0.1:8428/api/v1/write" # # Basic auth username BasicAuthUser = "" # # Basic auth password BasicAuthPass = "" # # timeout settings, unit: ms Headers = ["X-From", "n9e"] Timeout = 10000 DialTimeout = 3000 TLSHandshakeTimeout = 30000 ExpectContinueTimeout = 1000 IdleConnTimeout = 90000 # # time duration, unit: ms KeepAlive = 30000 MaxConnsPerHost = 0 MaxIdleConns = 100 MaxIdleConnsPerHost = 100 [root@flshcat-server etc]# systemctl restart n9e.service [root@flshcat-server etc]# systemctl status n9e.service #观察无报错即可!
1.4 安装ibex告警自愈(server)
1.[root@flshcat-server]# wget https://github.com/flashcatcloud/ibex/releases/download/v1.0.0/ibex-1.0.0.tar.gz #安装ibex模块 2.[root@flshcat-server ibex]# tar -xvf ibex-1.0.0.tar.gz -C /opt/ibex/ 3.[root@flshcat-server ibex]# mysql -uroot -p < sql/ibex.sql #会自动生成ibex库 [MySQL] #修改MySQL配置文件 # mysql address host:port Address = "127.0.0.1:3306" # mysql username User = "root" # mysql password Password = "" # database name DBName = "ibex" 4.[root@aly n9e]# cat <<EOF >/etc/systemd/system/ibex.service [Unit] Description="ibex.service" After=network.target [Service] Type=simple ExecStart=/opt/ibex/ibex server WorkingDirectory=/opt/ibex Restart=on-failure SuccessExitStatus=0 LimitNOFILE=65536 StandardOutput=syslog StandardError=syslog SyslogIdentifier=ibex.service [Install] WantedBy=multi-user.target EOF 5.[root@flshcat-server ibex]# systemctl daemon-reload 6.[root@flshcat-server ibex]# systemctl enable --now ibex.service #rpc监听20090,http_server监听10090 1.5 安装categraf采集器(agent)
讯享网[root@aly yeyin]# wget https://download.flashcat.cloud/categraf-v0.2.35-linux-amd64.tar.gz [root@aly yeyin]# tar zxvf categraf-v0.2.35-linux-amd64.tar.gz [root@aly yeyin]# cp -far categraf-v0.2.35-linux-amd64/* /opt/categraf [root@aly yeyin]# cp /opt/categraf/conf/categraf.service /etc/systemd/system/ [root@aly yeyin]# systemctl daemon-reload [root@aly yeyin]# systemctl enable --now categraf
1.6 访问夜莺
http://8.130.93.111:17000/metric/explorer #uers:root #passwd:root.2020 ![[外链图片转存失败,源站可能有防盗链机制,建议将图片保存下来直接上传(img-SfYaHtTY-1686996000037)(D:\文档\assets-监控\image-20230414141428802.png)]](https://img-blog.csdnimg.cn/78c16c414e3845f2a1d5f3209ccce8c0.png)
1.7 agent配置
讯享网1.#基础信息修改 vim /opt/categraf/conf/config.toml [[writers]] url = "http://8.130.93.111:17000/prometheus/v1/write" #server的地址 [heartbeat] enable = true url = "http://8.130.93.111:17000/v1/n9e/heartbeat" #重启agent观察是否在基础设施中出现 interval = 30 #30s上报一次,如果机器多调整成30~60s.减少server的压力! [ibex] enable = true servers = ["101.42.119.23:20090"] #n9e_server的rpc地址开启告警自愈 2.配置数据源! #新增普罗米修斯对象加入即可。需要填server的普罗米修斯的地址!! http://127.0.0.1:9090/ journalctl -u categraf -f #查看采集器的状态!!
![[外链图片转存失败,源站可能有防盗链机制,建议将图片保存下来直接上传(img-cRPjbb1g-1686996000039)(D:\文档\assets-监控\4a98445774d674e63b82b151eadbd451.png)]](https://img-blog.csdnimg.cn/6969ef29ec1445bebb67f610fb95509e.png)

1.8 配置nginx方向代理
1.8.1 nginx.conf配置
[root@yeyin-aly log]# yum -y install nginx [root@yeyin-aly nginx]# cat /etc/nginx/nginx.conf user nginx; worker_processes auto; error_log /var/log/nginx/error.log; pid /run/nginx.pid; # Load dynamic modules. See /usr/share/doc/nginx/README.dynamic. include /usr/share/nginx/modules/*.conf; events {
    worker_connections 1024; } http {
    log_format main '$remote_addr - $remote_user [$time_local] "$request" ' '$status $body_bytes_sent "$http_referer" ' '"$http_user_agent" "$http_x_forwarded_for"'; access_log /var/log/nginx/access.log main; sendfile on; tcp_nopush on; tcp_nodelay on; keepalive_timeout 65; types_hash_max_size 4096; include /etc/nginx/mime.types; default_type application/octet-stream; include /etc/nginx/proxy_flshcat; #引入夜莺的配置文件 }
1.8.2 夜莺nginx配置
讯享网[root@yeyin-aly nginx]# cat proxy_flshcat  server {
    listen 80; #listen 443; server_name flshcat.xxxx.com; server_tokens off; #root /opt/soft/n9e/pub; access_log /data/log/nginx/flschat_access.log; error_log /data/log/nginx/flschat_error.log; location / {
    client_max_body_size 50m; proxy_redirect off; proxy_set_header Host $host; proxy_set_header X-Real-IP $remote_addr; proxy_set_header X-Forwarded-For $proxy_add_x_forwarded_for; proxy_pass http://localhost:17000; #index index.html index.htm; } } [root@yeyin-aly nginx]# nginx -t nginx: the configuration file /etc/nginx/nginx.conf syntax is ok nginx: configuration file /etc/nginx/nginx.conf test is successful [root@yeyin-aly nginx]# nginx -s reload #访问域名即可.本地hosts需要加解析!
1.9 配置systemd服务日志输出
1.[root@yeyin-aly log]# cat /etc/rsyslog.d/prometheus.conf #需要在日志同步下新增文件 if $programname == 'prometheus' then /data/log/prometheus.log #将Prometheus的日志转发到自定义的位置 if $programname == 'programname' then stop 2.[root@yeyin-aly log]# rsyslogd -N1 -f /etc/rsyslog.d/prometheus.conf #测试语法是否正确 3.[root@yeyin-aly log]# systemctl daemon-reload 4.[root@yeyin-aly log]# systemctl restart prometheus.service rsyslog #查看是否产生运行日志即可 1.10 mysql异常问题处理
讯享网#mysql无法直接连接。restart之后由于sock文件的重建库不存在 1.重新启动后可以正常登录;但是soure备份数据的时候ERROR 1045 (28000): Access denied for user 'root'@'%' (using password: YES) 2.在my.conf中设置免密登录; skip-grant-tables 3.重启mysqld服务输入mysql进入mysql mysql> flush privileges; #先刷新特权 Query OK, 0 rows affected (0.00 sec) mysql> GRANT ALL PRIVILEGES ON *.* TO 'root'@'%'IDENTIFIED BY '' WITH GRANT OPTION; #重新授权 Query OK, 0 rows affected, 1 warning (0.00 sec) mysql> flush privileges; Query OK, 0 rows affected (0.01 sec) 4.取消my.conf中的免密 5.重新启动mysql mysql> create database test; Query OK, 1 row affected (0.00 sec) 6.重新source即可 #问题所在: 1.mysql没有调优,开放了外网IP。导致大量破坏的ip涌入服务器. 2.2023-04-25T11:40:33.Z 357 [Warning] Hostname 'zg-1220g-199.stretchoid.com' does not resolve to '162.243.143.30'. #不再进行反解析(ip不反解成域名),这样可以加快数据库的反应时间。 #解决: [root@n9e-server mysql]# vim /etc/my.cnf skip-name-resolve #增加不解析域名的访问 bind-address=127.0.0.1 #监听本机的127.0.0.1禁止其他机器
![[外链图片转存失败,源站可能有防盗链机制,建议将图片保存下来直接上传(img-4NOQpbU4-1686996000039)(D:\文档\assets-监控\image-20230510094423641.png)]](https://img-blog.csdnimg.cn/e242ff0404a44e9a8ef09b1cbd0e2800.png)
![[外链图片转存失败,源站可能有防盗链机制,建议将图片保存下来直接上传(img-LVwnqAUs-1686996000040)(D:\文档\assets-监控\image-20230510144420730.png)]](https://img-blog.csdnimg.cn/504f51435d0048f2b8ed1cf51398322c.png)
1.12 prometheus异常问题处理
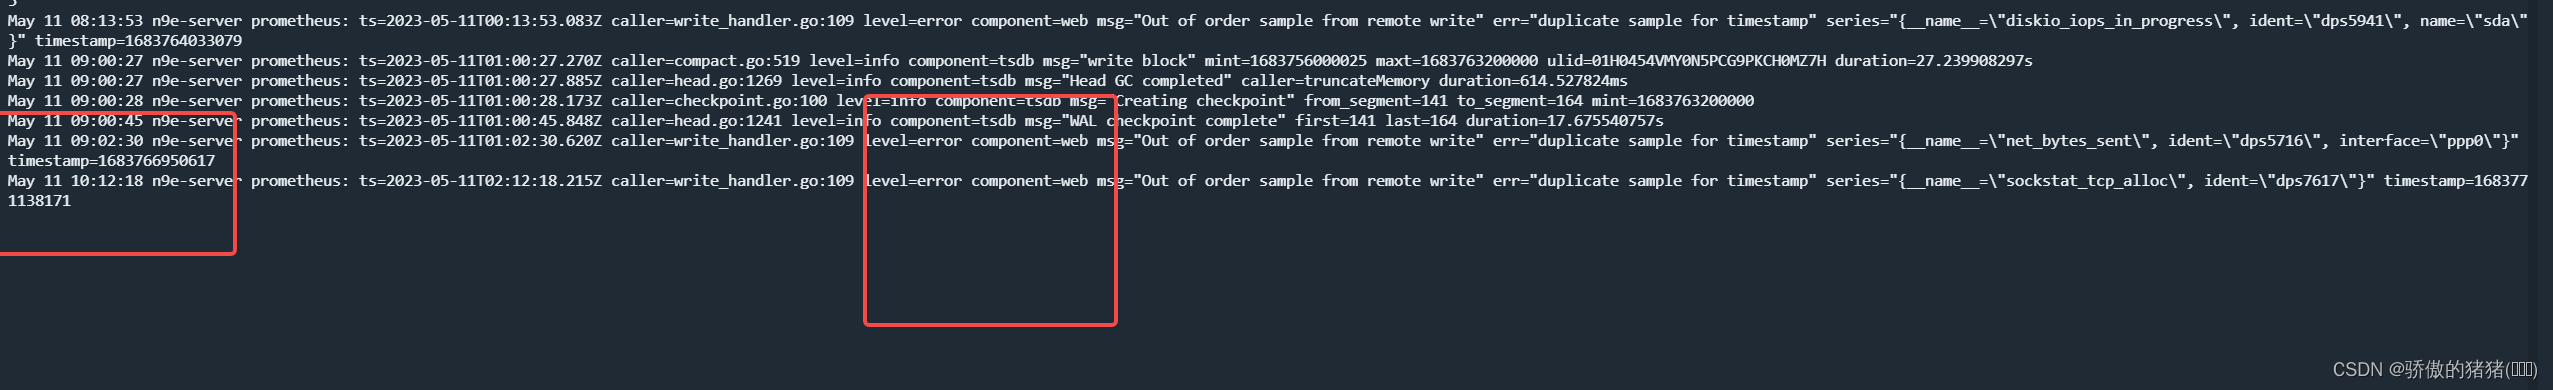
问题描述: 1.由于Prometheus是时序数据库,根据时间戳的方式进行数据的采集和持久化。 2.下面问题发生是因为就是数据采集节点dps和服务节点系统n9e-server时间差距太大引起的,需要控制在30s内。太多的乱序数据进入Prometheus会导致Prometheus服务停止服务。 解决: #因为n9e和Prometheus在一台机器上,节点数据是先上报到n9e在rewrite到Prometheus中所以在啊n9e的配置中添加 ForceUseServerTS = true #要求节点的时间戳改为本机的时间戳。大大减少了错误率 https://github.com/ccfos/nightingale/discussions/1162 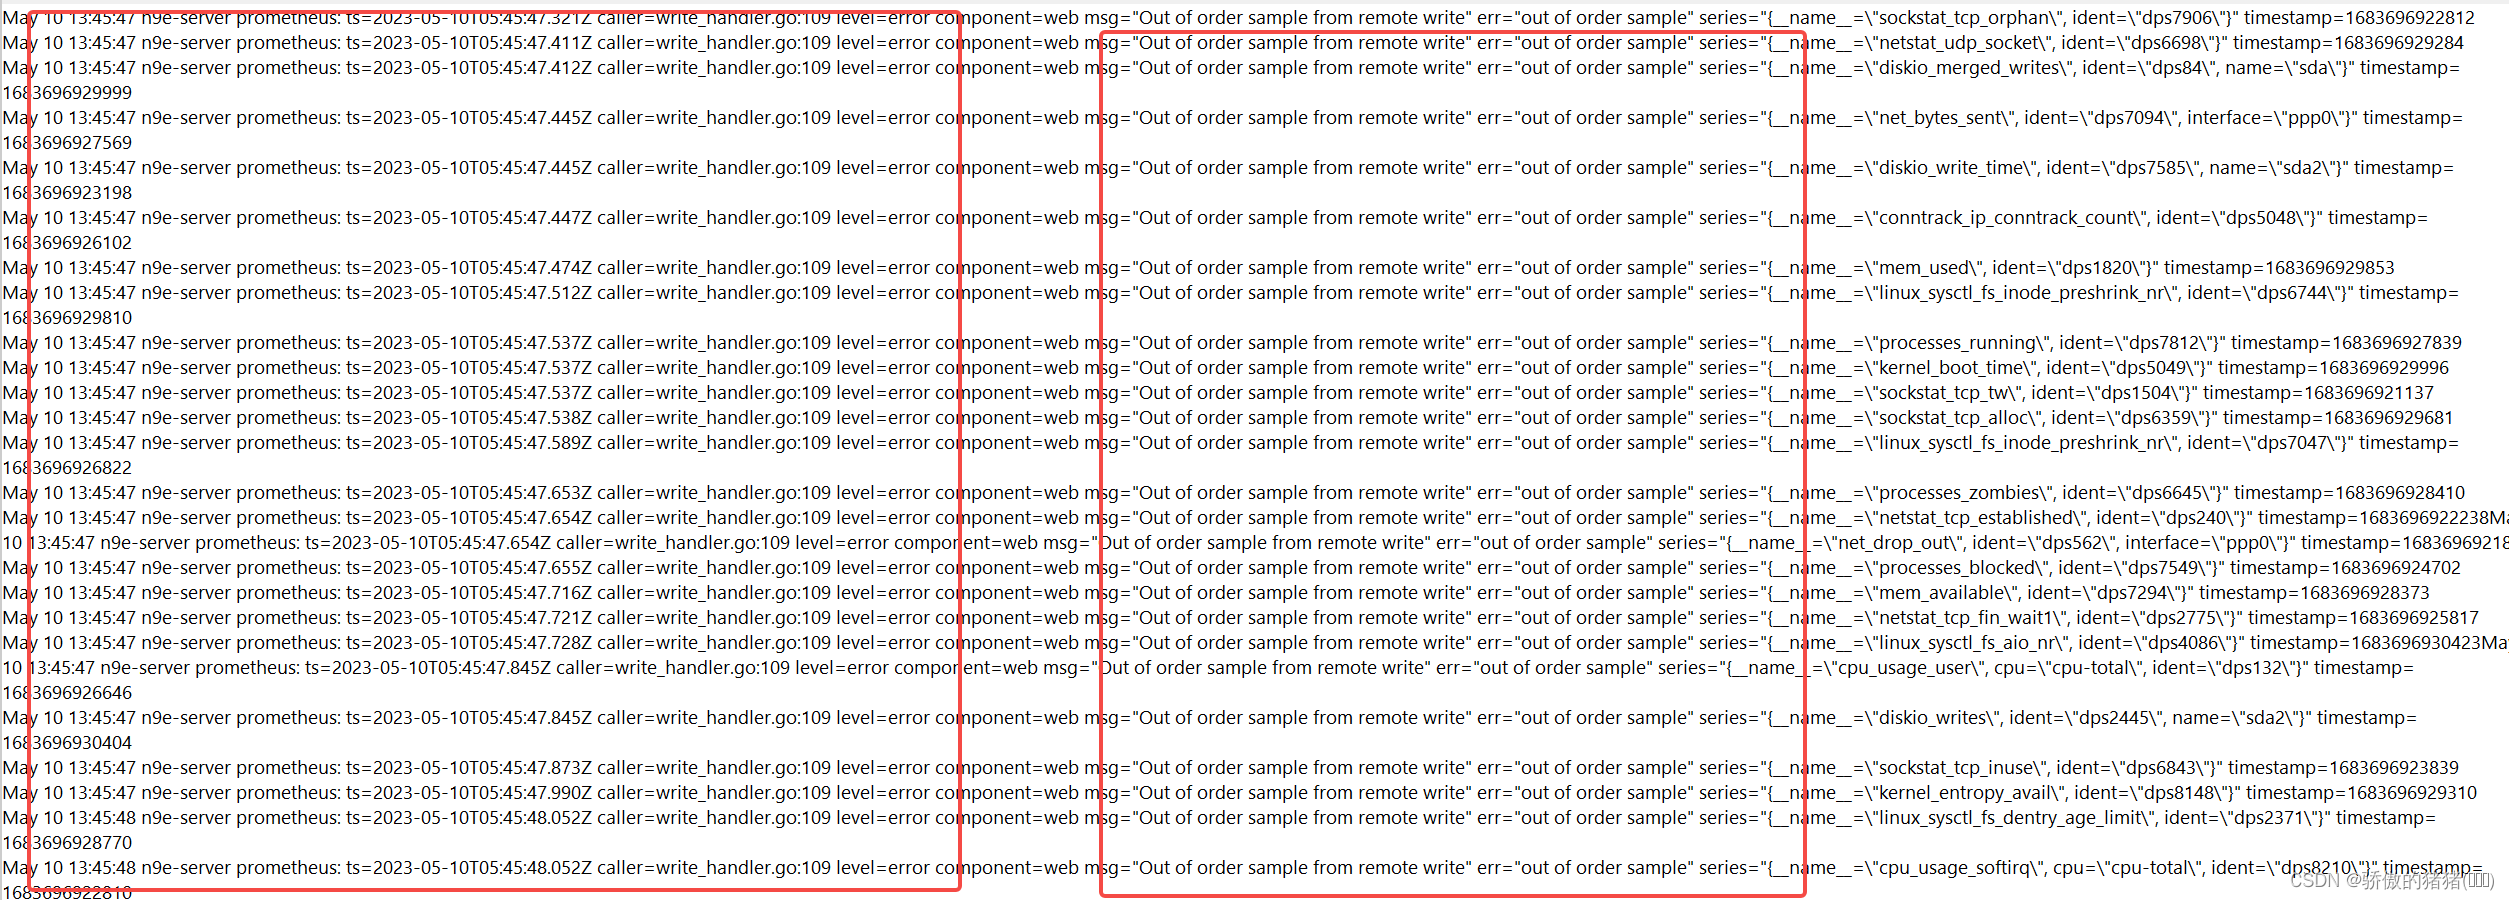
1.12 prometheus异常问题处理
讯享网问题描述: 1.由于Prometheus是时序数据库,根据时间戳的方式进行数据的采集和持久化。 2.下面问题发生是因为就是数据采集节点dps和服务节点系统n9e-server时间差距太大引起的,需要控制在30s内。太多的乱序数据进入Prometheus会导致Prometheus服务停止服务。 解决: #因为n9e和Prometheus在一台机器上,节点数据是先上报到n9e在rewrite到Prometheus中所以在啊n9e的配置中添加 ForceUseServerTS = true #要求节点的时间戳改为本机的时间戳。大大减少了错误率 https://github.com/ccfos/nightingale/discussions/1162
版权声明:本文内容由互联网用户自发贡献,该文观点仅代表作者本人。本站仅提供信息存储空间服务,不拥有所有权,不承担相关法律责任。如发现本站有涉嫌侵权/违法违规的内容,请联系我们,一经查实,本站将立刻删除。
如需转载请保留出处:https://51itzy.com/kjqy/45781.html