
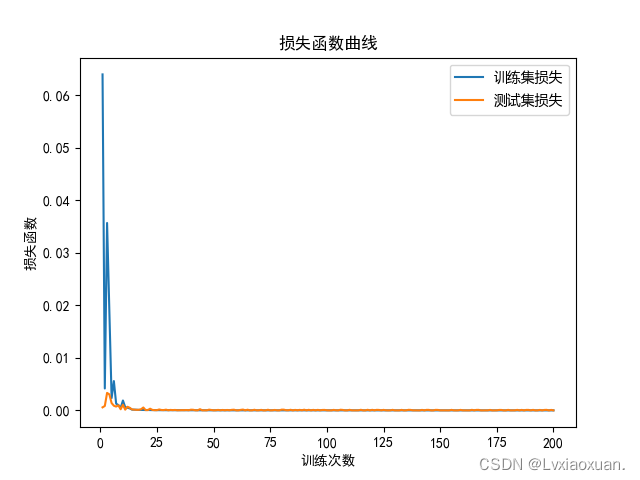
- 交叉熵能够衡量同一个随机变量中的两个不同概率分布的差异程度,在机器学习中就表示为真实概率分布与预测概率分布之间的差异。
- 交叉熵的值越小,模型预测效果就越好。
- 交叉熵经常搭配softmax使用,将输出的结果进行处理,使其多个分类的预测值和为1,再通过交叉熵来计算损失。
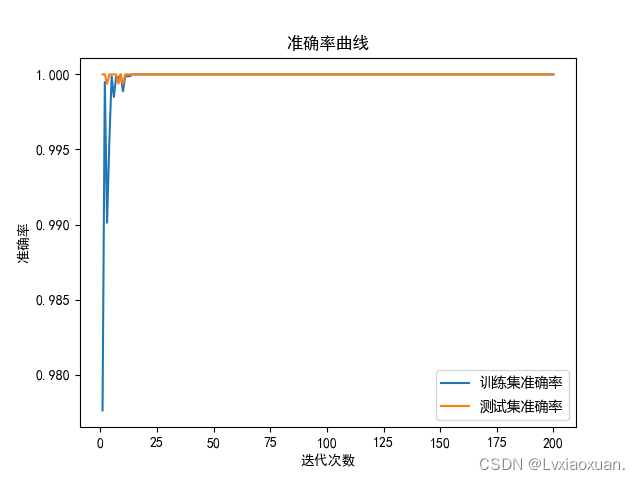
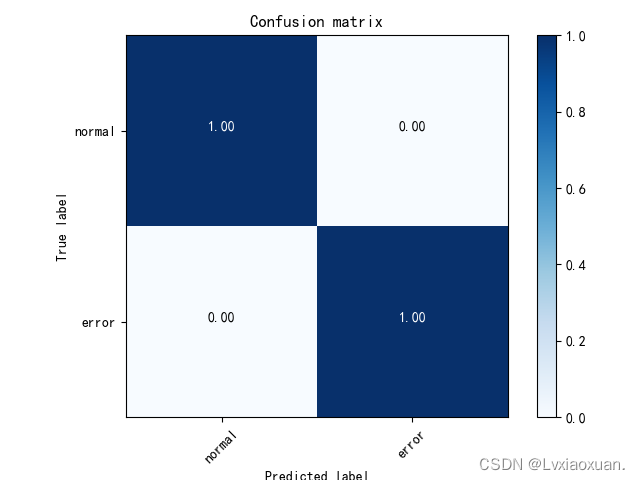
import os os.environ["KMP_DUPLICATE_LIB_OK"]="TRUE" import torch import torchvision import torchvision.transforms as transforms import matplotlib.pyplot as plt import numpy as np import sys import torch.nn as nn import torch.nn.functional as F import torch.optim as optim from PIL import Image from torch.utils.data import Dataset import scipy.io as io import random from datetime import datetime import contextlib from matplotlib import font_manager import itertools from sklearn.metrics import confusion_matrix #from from visdom import Visdom from torch.utils.tensorboard import SummaryWriter os.environ["CUDA_VISIBLE_DEVICES"] = "0" device = torch.device("cuda" if torch.cuda.is_available() else "cpu") def plot_confusion_matrix(cm, classes, normalize=False, title='Confusion matrix', cmap=plt.cm.Blues): #cm : 计算出的混淆矩阵的值;classes : 混淆矩阵中每一行每一列对应的列; normalize : True:显示百分比, False:显示个数 if normalize: cm = cm.astype('float') / cm.sum(axis=1)[:, np.newaxis] print("Normalized confusion matrix") else: print('Confusion matrix, without normalization') print(cm) plt.imshow(cm, interpolation='nearest', cmap=cmap) plt.title(title) plt.colorbar() tick_marks = np.arange(len(classes)) plt.xticks(tick_marks, classes, rotation=45) plt.yticks(tick_marks, classes) fmt = '.2f' if normalize else 'd' thresh = cm.max() / 2. for i, j in itertools.product(range(cm.shape[0]), range(cm.shape[1])): plt.text(j, i, format(cm[i, j], fmt), horizontalalignment="center", color="white" if cm[i, j] > thresh else "black") plt.tight_layout() plt.ylabel('True label') plt.xlabel('Predicted label') class Net(nn.Module): def __init__(self): super(Net, self).__init__() self.conv1 = nn.Conv2d(1, 32, 5, padding=2) self.conv2 = nn.Conv2d(32, 64, 3, padding=1) self.conv3 = nn.Conv2d(64, 128, 3, padding=1) self.conv4 = nn.Conv2d(128, 256, 3, padding=1) self.pool = nn.MaxPool2d(2) self.fc1 = nn.Linear(4*4*256, 2560) self.fc2 = nn.Linear(2560, 2) def forward(self, x): x = self.pool(F.relu(self.conv1(x))) x = self.pool(F.relu(self.conv2(x))) x = self.pool(F.relu(self.conv3(x))) x = self.pool(F.relu(self.conv4(x))) x = x.view(-1, 4*4*256) x = F.relu(self.fc1(x)) x = self.fc2(x) return x PATH = "cnn_net.pth" net = Net().to(device) # net.load_state_dict(torch.load(PATH)) print("load success") Loss = nn.CrossEntropyLoss() optimizer = optim.SGD(net.parameters(), lr=0.01, momentum=0.9) train_pics_dict = np.load("train_pics.npz") train_labels_dict = np.load("train_labels.npz") test_pics_dict = np.load("test_pics.npz") test_labels_dict = np.load("test_labels.npz") train_pics = [] train_labels = [] test_pics = [] test_labels = [] for j in train_pics_dict: train_pics.append(train_pics_dict[j]) train_labels.append(int(train_labels_dict[j])) for j in test_pics_dict: test_pics.append(test_pics_dict[j]) test_labels.append(int(test_labels_dict[j])) print(test_labels) class MyData(Dataset): def __init__(self, pics, labels): self.pics = pics self.labels = labels def __getitem__(self, index): assert index < len(self.pics) return torch.Tensor([self.pics[index]]), self.labels[index] def __len__(self): return len(self.pics) def get_tensors(self): return torch.Tensor([self.pics]), torch.Tensor(self.labels) # 解决中文显示问题 plt.rcParams['font.sans-serif'] = ['SimHei'] plt.rcParams['axes.unicode_minus'] = False def main(argv=None): # classes = ("normal", "ball", "inner", "outer") classes = ("normal", "error") # classes = ( # "normal", # "ball_18", # "ball_36", # "ball_54", # "inner_18", #"inner_36", #"inner_54", #"outer_18", #"outer_36", #"outer_54", #) trainset = MyData(train_pics, train_labels) trainloader = torch.utils.data.DataLoader(trainset, batch_size=4, shuffle=True, num_workers=2) testset = MyData(test_pics, test_labels) testloader = torch.utils.data.DataLoader(testset, batch_size=4, shuffle=True, num_workers=2) loss_list = [] i_list = [] loss_list2 = [] acc_list = [] acc_list2 = [] interation = 0 for epoch in range(100): net.train() running_loss = 0 correct = 0 total = 0 for i, (inputs, labels) in enumerate(trainloader): inputs = inputs.cpu() labels = labels.cpu() outputs = net(inputs) loss = Loss(outputs, labels) optimizer.zero_grad() loss.backward() optimizer.step() running_loss += loss.item() total += 4 _, predicts = torch.max(outputs, 1) correct += (predicts == labels).sum().item() if i % 2000 == 1999: print("epoch:", epoch, "[", i - 1999, ":", i, ":]", running_loss / 2000, correct / total) interation += 1 i_list.append(interation) y = correct / total acc_list.append(y) x = running_loss / 2000 loss_list.append(x) running_loss = 0 total = 0 correct = 0 PATH = "cnn_net.pth" torch.save(net.state_dict(), PATH) print("save success") net.eval() with torch.no_grad(): running_loss = 0 correct = 0 total = 0 preds = [] label = [] for i, (inputs, labels) in enumerate(testloader): inputs = inputs.cpu() labels = labels.cpu() outputs = net(inputs) loss = Loss(outputs, labels) _, predicts = torch.max(outputs, 1) correct += (predicts == labels).sum().item() total += 4 running_loss += loss.item() preds.append(predicts) label.append(labels) if i % 400 == 399: y = correct / total acc_list2.append(y) x = running_loss / 400 loss_list2.append(x) running_loss = 0 total = 0 correct = 0 preds = torch.cat(preds) label = torch.cat(label) preds = np.array(preds.cpu()).tolist() label = np.array(label.cpu()).tolist() print(preds) print(label) print(acc_list) print(acc_list2) print(loss) print(loss_list2) my_font = font_manager.FontProperties(fname= "C:/Windows/Fonts/msyh.ttc") plt.plot(i_list, acc_list, label=u"训练集准确率") plt.plot(i_list, acc_list2, label=u"测试集准确率") plt.xlabel("迭代次数") plt.ylabel("准确率") plt.title("准确率曲线") plt.legend(prop=my_font) plt.show() plt.plot(i_list, loss_list, label=u"训练集损失") plt.plot(i_list, loss_list2, label=u"测试集损失") plt.xlabel("训练次数") plt.ylabel("损失函数") plt.title("损失函数曲线") plt.legend(prop=my_font) plt.show() cm = confusion_matrix(label, preds) plot_confusion_matrix(cm, classes, "confusion matrix") plt.show() if __name__ == "__main__": sys.exit(main()) # viz = Visdom() # # # class Confusionmatrix(object): # def __init__(self, num_classes: int, labels: list): # self.matrix = np.zeros((num_classes, num_classes)) # self.num_classes = num_classes # self.labels = labels # # def update(self, predicts, labels): # for p, t in zip(predicts, labels): # self.matrix[p, t] += 1 # # def summary(self): # sum_tp = 0 # n = np.sum(self.matrix) # for i in range(self.num_classes): # sum_tp += self.matrix[i, i] # acc = sum_tp / n # print("acc:", acc) # # table = PrettyTable() # table.field_names = ["", "Precision", "Recall", "Specificity"] # for i in range(self.num_classes): # TP = self.matrix[i, i] # FP = np.sum(self.matrix[i, :]) - TP # FN = np.sum(self.matrix[:, i]) - TP # TN = np.sum(self.matrix) - TP - FP - FN # Precision = round(TP / (TP + FP), 3) # Recall = round(TP / (TP + FN), 3) # Specificity = round(TN / (TN + FP), 3) # table.add_row([self.labels[i], Precision, Recall, Specificity]) # print(table) # # def plot(self): # matrix = self.matrix # print(matrix) # plt.imshow(matrix, cmap=plt.cm.Blues) # # plt.xticks(range(self.num_classes), self.labels, rotation=45) # plt.yticks(range(self.num_classes), self.labels) # plt.colorbar() # plt.xlabel("True Labels") # plt.ylabel("Predicts Labels") # plt.title("Confusion Matrix") # # thresh = matrix.max() / 2 # for x in range(self.num_classes): # for y in range(self.num_classes): # info = int(matrix[y, x]) # plt.text(x,y,info, # verticalalignment="center", # horizontalalignment="center", # color="white" if info > thresh else "black") # plt.tight_layout() # plt.show() 讯享网

版权声明:本文内容由互联网用户自发贡献,该文观点仅代表作者本人。本站仅提供信息存储空间服务,不拥有所有权,不承担相关法律责任。如发现本站有涉嫌侵权/违法违规的内容,请联系我们,一经查实,本站将立刻删除。
如需转载请保留出处:https://51itzy.com/kjqy/26930.html