
目录
本项目所需js文件:
一、了解无人售货机零售项目背景
1.背景
2.分析无人售货机现状
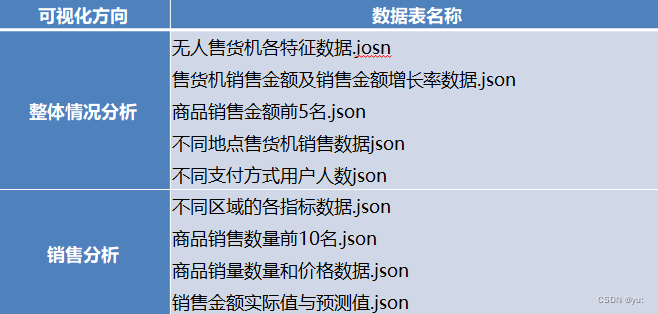
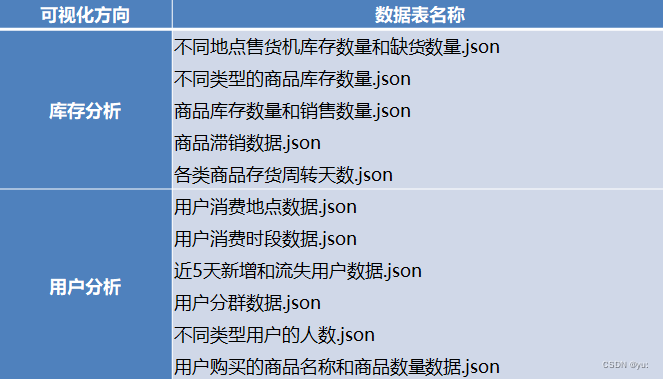
3.需要使用无人售货机的数据表
二、可式化展示销售情况总分析
1.整体效果呈现:
2.代码实现
a:销售金额 & 订单量 & 毛利润 & 售货机数量 & 购买用户数
b:销售金额变化趋势(双y轴)
c:商品销售金额Top5(条形图)
d:售货机销售情况(柱状图)
e:支付方式占比(饼图)
3.所有代码
三、可视化展现销售分析
1.整体效果呈现
2.代码实现
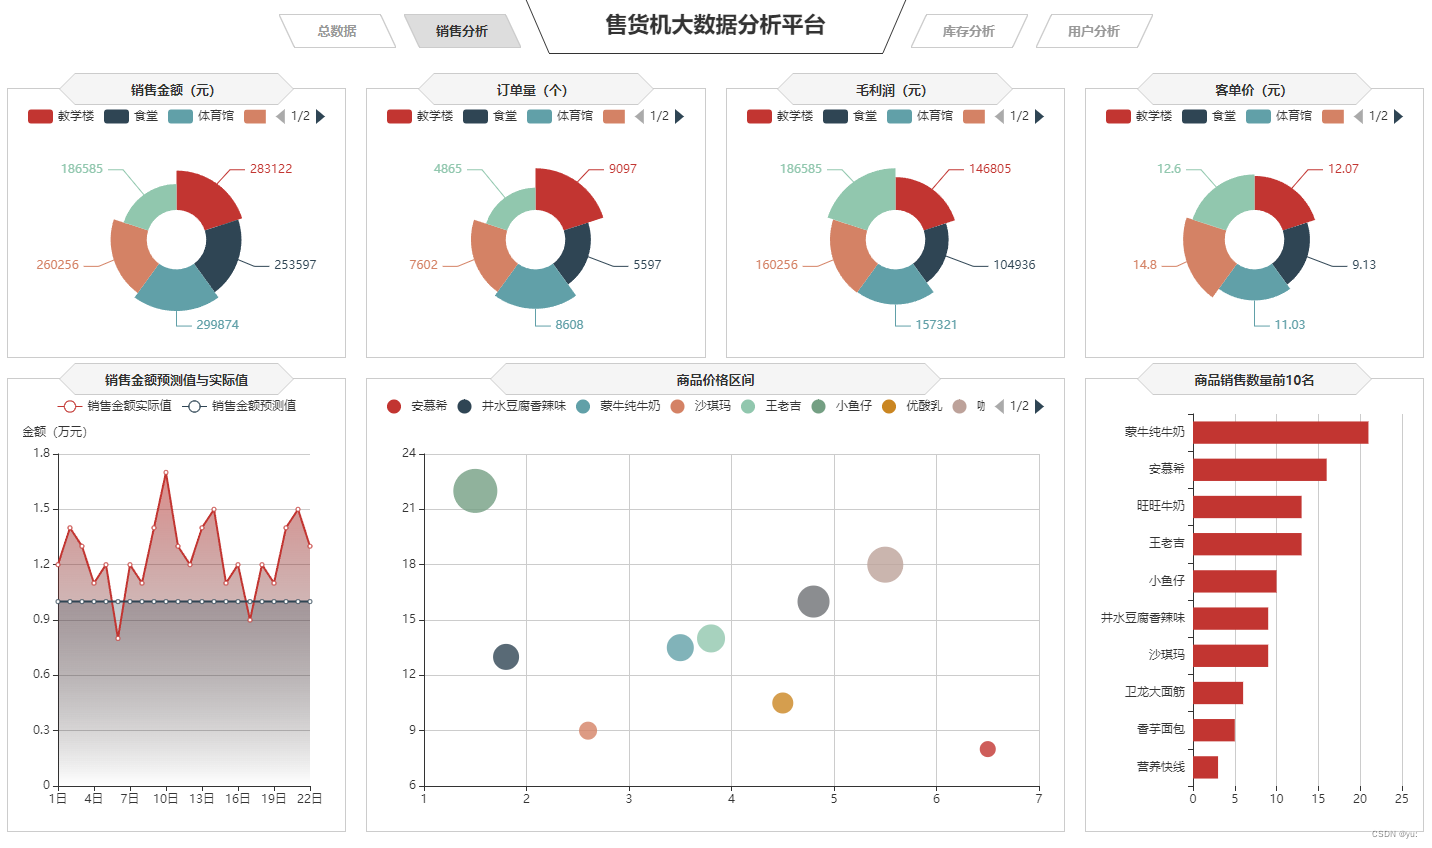
a:销售金额&订单量&毛利润&客单价平均值(南丁格尔玫瑰图)
b:销售金额预测值与实际值(折线图)
c:商品价格区间(散点图)
d:商品销售数量Top10(条形图)
3.所有代码
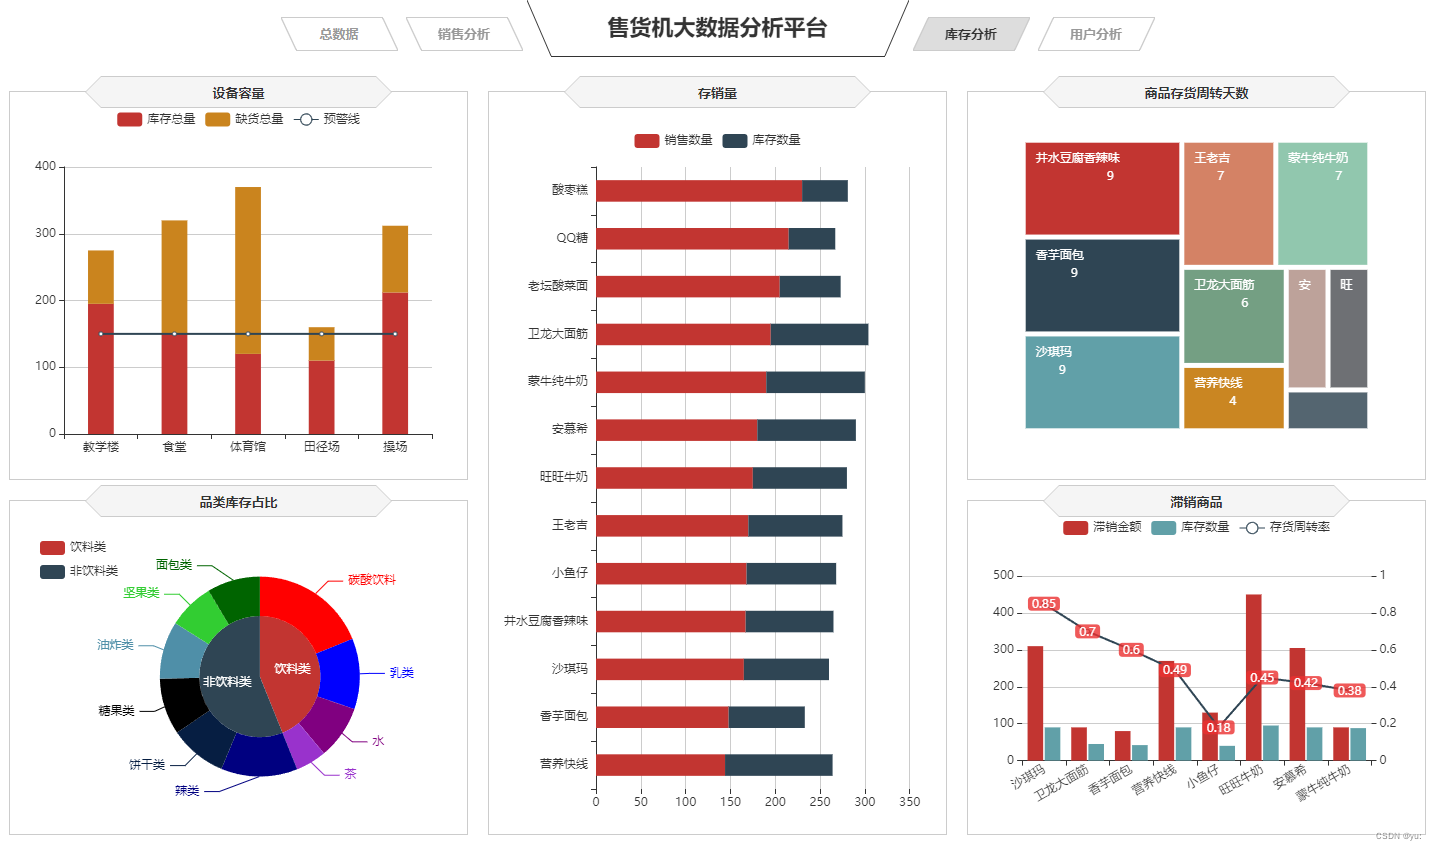
四、可视化展现库存分析
1.整体效果呈现
2.代码实现
a:商品存货周转天数(矩形树图)
b:设备容量(柱状堆积)
c:存销量(条形堆积)
d:滞销商品(双y轴)
e:品类库存占比(圆环饼图)
3.所有代码
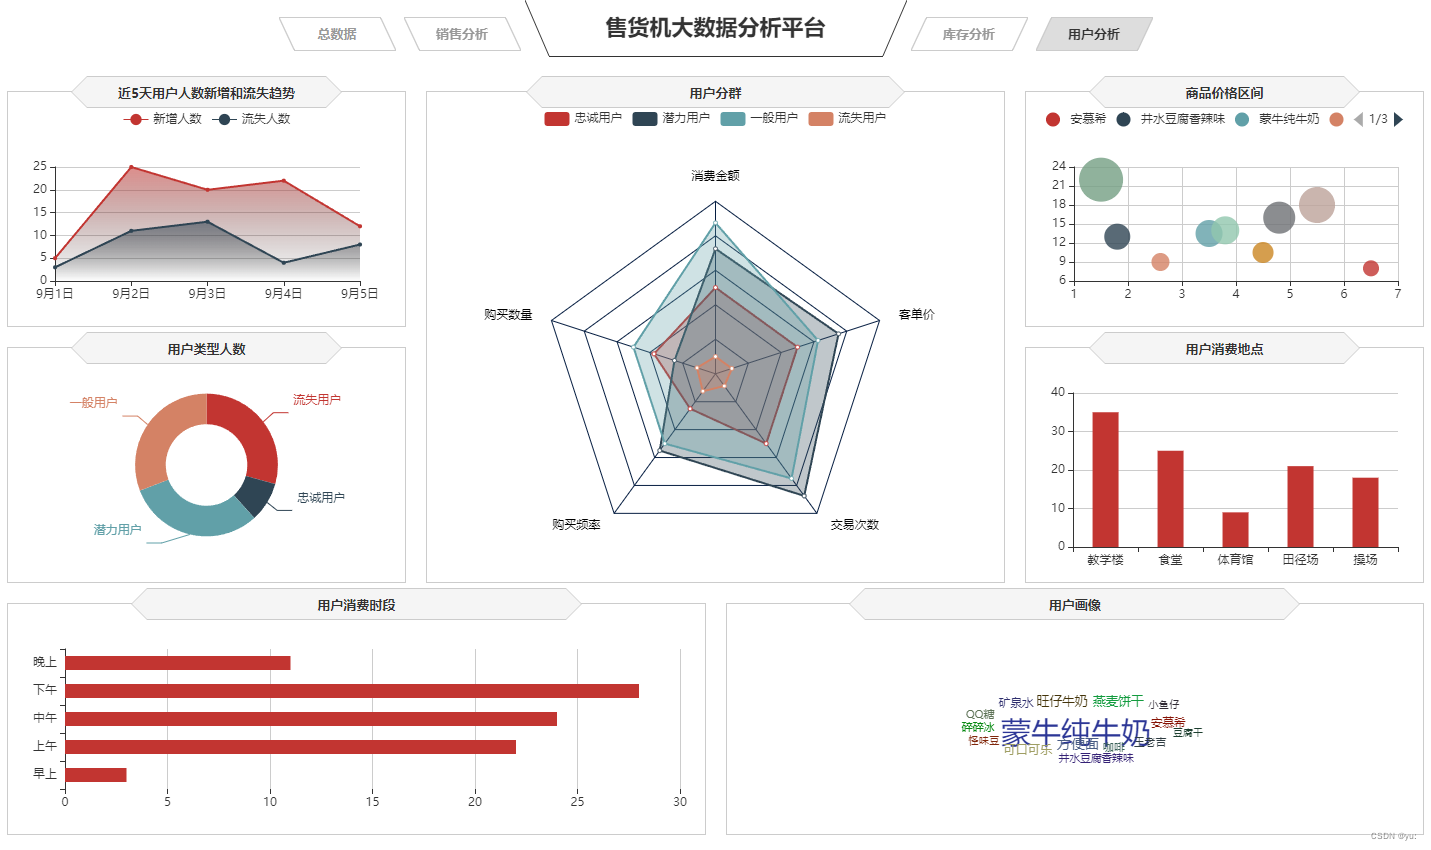
五、可视化展示用户分析
1.整体效果呈现
3.所有代码
2.代码实现
a:近5日用户人数新增和流失趋势(折线图)
b:用户类型人数(圆环图)
c: 用户分群(雷达图)
d:用户消费时段(条形图)
e:用户消费地点(柱状图)
f:商品价格区间(散点图)
g:用户画像(词云图)
3.所有代码
本项目所需js文件:
echarts
echarts-wordcloud.min
jquery-3.3.1
lossgrowth
一、了解无人售货机零售项目背景
1.背景
无人售货机是商业自动化的常用设备,它不受时间、地点的限制,能节省人力、方便交易。
某公司部署的无人售货机,目前经营状况并不理想。为了挖掘经营状况不理想的具体原因,需要了解该公司后台管理系统数据的基本情况。
2.分析无人售货机现状
无人售货机产业正在走向信息化,并将进一步实现合理化。从无人售货机的发展趋势来看,无人售货机的出现是由劳动密集型的产业构造向技术密集型转变的产物。
大量生产、大量消费以及消费模式和销售环境的变化,要求出现新的流通渠道;而相对的超市、百货购物中心等新的流通渠道的产生,人工费用也在不断上升;加上场地的局限性和购物的便利性等因素的制约,无人售货机作为一种必需的机器便应运而生。
某公司部署的无人售货机在高需求背景下,销售额提升缓慢,订单量并未达到预期。为了探究问题的具体原因,需要结合销售背景从销售、库存、用户3个方向进行分析,并利用ECharts可视化展现销售现状,从而分析问题所在。
3.需要使用无人售货机的数据表
二、可式化展示销售情况总分析
1.整体效果呈现:
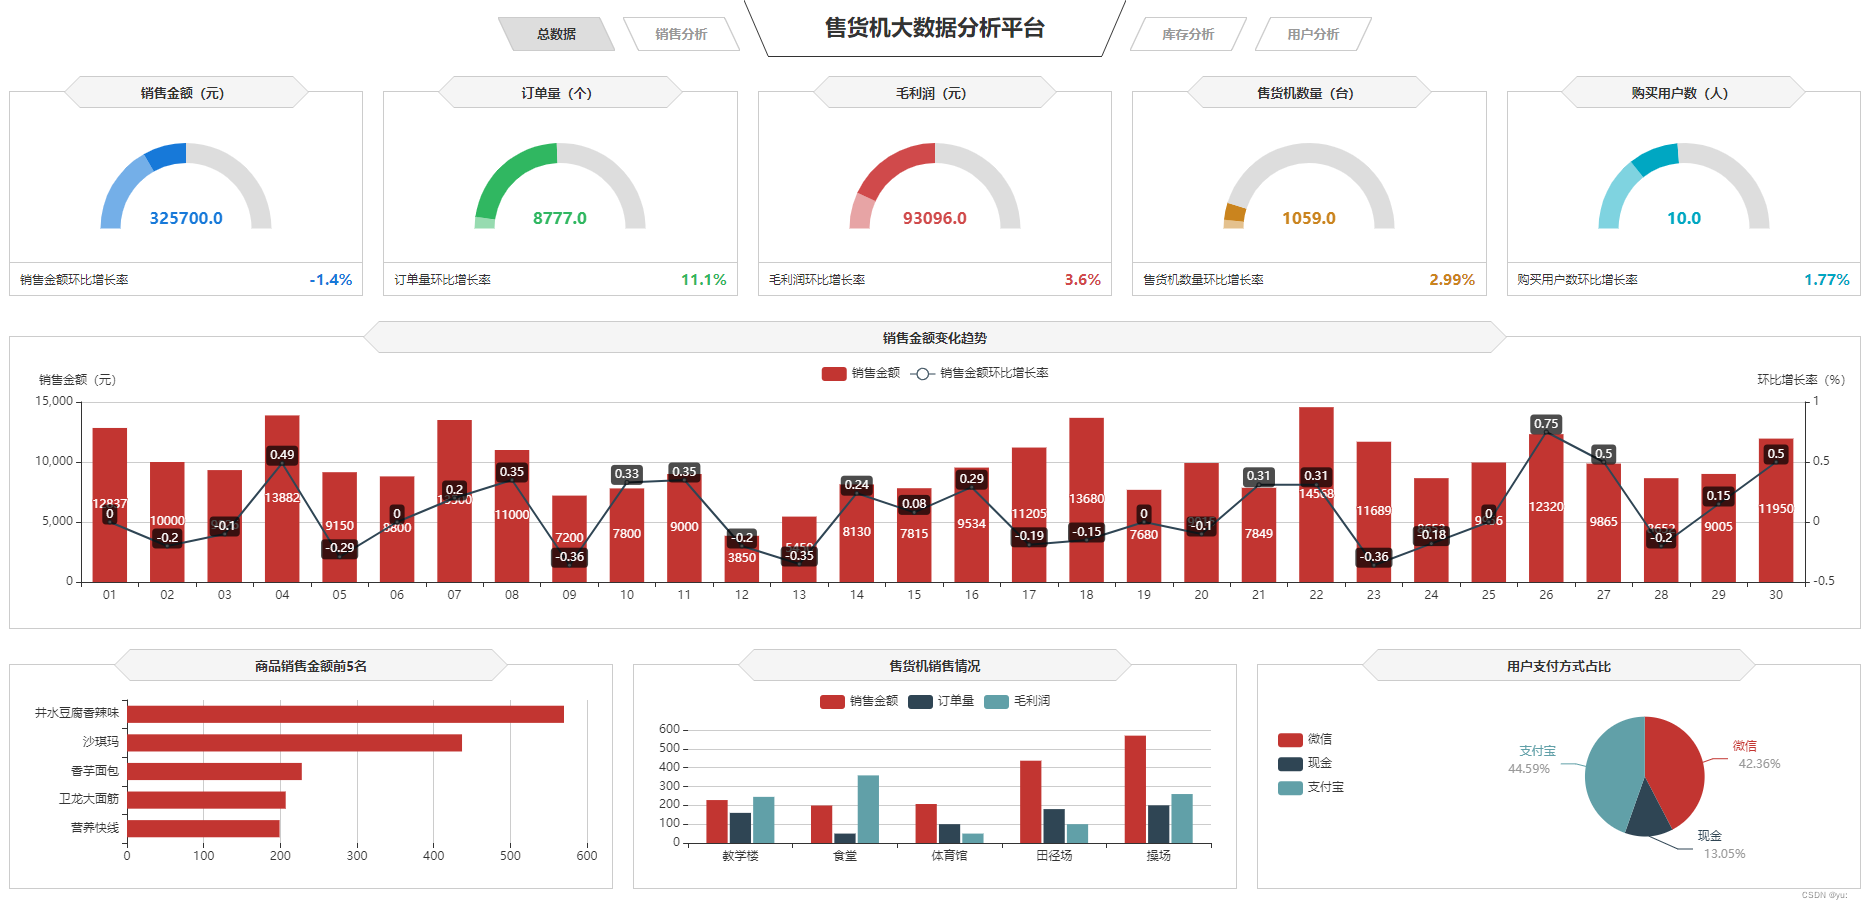
由以上图片可知,销售金额、订单量、毛利润、售货机数量、购买用户数这五个模块是需要仪表盘
2.代码实现
a:销售金额 & 订单量 & 毛利润 & 售货机数量 & 购买用户数
1)新建一个JavaScript的项目,命名为chart.total.js
2)插入销售金额 & 订单量 & 毛利润 & 售货机数量 & 购买用户数的数据(仪表盘)
$.get("data/无人售货机各特征数据.json").done(function (data) { //data = JSON.parse(data); saleT('saleM', '销售金额', 0, data.销售金额[0], data.销售金额[1], data.销售金额[2], '','#1779d9','rgba(23,121,217,0.6)'); saleT('orderQ', '订单量', 0, data.订单量[0], data.订单量[1], data.订单量[2], '','#30b761','rgba(48,183,97,0.5)'); saleT('grossM', '毛利润', 0, data.毛利润[0], data.毛利润[1], data.毛利润[2], '','#d04a4b','rgba(208,74,75,0.5)'); saleT('discount', '折扣额', 0, data.折扣额[0], data.折扣额[1], data.折扣额[2], '千','#ca841e','rgba(202,132,30,0.5)'); saleT('unitP', '客单价', 0, data.客单价[0], data.客单价[1], data.客单价[2], '','#00a7c2','rgba(0,167,194,0.5)'); });讯享网
3)初始化图表
讯享网var saleM = echarts.init(document.getElementById("saleM")); var orderQ = echarts.init(document.getElementById("orderQ")); var grossM = echarts.init(document.getElementById("grossM")); var discount = echarts.init(document.getElementById("discount")); var unitP = echarts.init(document.getElementById("unitP"));
4)完善图表内容

function saleT(id, title, min, max, val, tag, unit, color1, color2) { var myChart = echarts.init(document.getElementById(id)); option = { tooltip: { confine:true, trigger: 'item', formatter:function(data){ hbl = (data.value/tag).toFixed(2); return title + ":" + data.value + '<br/>' + name + ":" + hbl } }, series: [{ startAngle: 180, endAngle: 0, splitNumber: 1, name: title, type: 'gauge', radius: '100%', axisLine: { lineStyle: { color: [ [0.25, '#1779da'], [0.5, '#1779da'], [1, '#ddd'] ], width: 20 } }, axisTick: { show: false }, axisLabel: { distance:0, width:30, height:24, lineHeight:24, padding:[25,-30,0], color:'rgba(255,255,255,0.5)', formatter: function (value) { if(unit=='千'){ return (value/1000).toFixed(1) + ' ' + unit; }else if(unit=='万'){ return (value/10000).toFixed(1) + ' ' + unit; }else{ return value; } } }, splitLine: { show: false }, pointer: { show:false, width: 3 }, title: { offsetCenter: [0, '92%'], color:'rgba(255,255,255,0.7)' }, detail: { offsetCenter: [0, '-10%'], formatter: function(value){ value1 = value / tag; return '{a|' + value.toFixed(1) + '}'; }, rich: { a: { fontSize:'16', fontWeight:'bold' } } }, data: [{}] }] }; option.series[0].min = min; option.series[0].max = max; option.series[0].data[0].value = val; option.series[0].axisLine.lineStyle.color[0][0] = (tag - min) / (max - min); option.series[0].axisLine.lineStyle.color[0][1] = color2; option.series[0].axisLine.lineStyle.color[1][0] = (val - min) / (max - min); option.series[0].axisLine.lineStyle.color[1][1] = color1; myChart.setOption(option); }这个模块是涵盖了五个仪表盘的数据
b:销售金额变化趋势(双y轴)
1)初始化图表
讯享网var saleRate = echarts.init(document.getElementById('saleRate'));
2)设置图表option值
$.get("data/售货机销售金额及其环比增长率.json").done(function (data) { //data = JSON.parse(data); saleRate.setOption({ tooltip: { trigger: 'axis', axisPointer: { type: 'cross' } },3)用网格定位图表四边留空及顶部避开标题位置,使坐标轴数据能完整显示
讯享网grid: { x: 10, y: 50, x2: 10, y2: 10, containLabel: true },
4)设置legend位置及数据,位于图表右上方
legend: { data:['销售金额','销售金额环比增长率'], top: 10 }, barCategoryGap:'40%',5)运用eCharts内置方法格式化日期,使x轴日期数据更简洁,同时不影响原数据在鼠标交互时的完整展现
讯享网xAxis: [ { type: 'category', //日期数据 data: data.日期, axisPointer: { type: 'shadow' }, axisLabel: { formatter: function(value){ return echarts.format.formatTime('dd', value); } } } ],
6)设置Y坐标轴最小值、最大值和坐标轴间隔值
yAxis: [ { type: 'value', name: '销售金额(元)', //设置Y坐标轴最小值 min: 0, //设置Y坐标轴最大值 max: 15000, //设置Y坐标轴值间隔值 interval: 5000 },定义Y轴右侧坐标轴
讯享网{ type: 'value', name: '环比增长率(%)', min: -0.5, max: 1, interval: 0.5 } ],
7)series:
series: [ { name:'销售金额', type:'bar', //设置显示坐标点数值 label:{ show:'true' }, //销售金额数据 data:data.销售金额 }, { name:'销售金额环比增长率', type:'line', //设置“销售金额环比增长率”数值样式,圆角矩形黑底白字,位于数据点上方 label:{ //设置显示坐标点数值 show:'true', color:'#fff', backgroundColor:'rgba(0,0,0,0.7)', verticalAlign:'middle', padding:4, borderRadius:4, position:'top' }, //设置“销售金额环比增长率”在坐标轴右侧显示 yAxisIndex: 1, //销售金额环比增长率数据 data:data.销售金额环比增长率 } ] }) });c:商品销售金额Top5(条形图)
其实内容都大差不差,就是更改数据和图表更换
1)设置图表option值
讯享网$.get("data/售货机销售金额及其环比增长率.json").done(function (data) { //data = JSON.parse(data); saleRate.setOption({ tooltip: { trigger: 'axis', axisPointer: { type: 'cross' } },
2)var 初始化图表,和引用售货机金额及其环比增长率.json文件导入数据,和对标题的描写
grid: { x: 10, y: 50, x2: 10, y2: 10, containLabel: true3)用网格定位图表四边留空及顶部避开标题位
讯享网legend: { data:['销售金额','销售金额环比增长率'], top: 10 }, barCategoryGap:'40%',
d:售货机销售情况(柱状图)
1)我们只需要在柱状图的基础上把x轴改成数据轴即可
xAxis: { type: 'value', boundaryGap: [0, 0.01], axisLine:{lineStyle:{width:0}}, }, yAxis: { type: 'category', splitLine:{lineStyle:{width:0}}, data: data.商品名称e:支付方式占比(饼图)
1)这里是设置他为饼图类型
讯享网 series : [ { name: '支付方式占比', type: 'pie', radius : '62%', center: ['65%', '50%'], label:{ formatter:"{b}\n{a|{d}%}", rich: { a: { padding:6, align:'left', color:'#999', } } }, data:data.data, itemStyle: { emphasis: { shadowBlur: 10, shadowOffsetX: 0, shadowColor: 'rgba(0, 0, 0, 0.5)' } } } ] }) });
2)center设置他的饼图的中心(圆心)坐标,数组的第一项是横坐标,第二项是纵坐标和显示触发显示等
var payWay = echarts.init(document.getElementById('payWay')); $.get("data/不同支付方式用户人数.json").done(function (data) { //data = JSON.parse(data); payWay.setOption({ tooltip : { trigger: 'item', formatter: "{a} <br/>{b} : {c} ({d}%)" }, legend: { data: data.支付方式, orient:'vertical', left:0, top:"25%" }, grid: { left: '0%', right: '0%', bottom: '0%', containLabel: true }, series : [ { name: '支付方式占比', type: 'pie', radius : '62%', center: ['65%', '50%'], label:{ formatter:"{b}\n{a|{d}%}", rich: { a: { padding:6, align:'left', color:'#999', } } }, data:data.data, itemStyle: { emphasis: { shadowBlur: 10, shadowOffsetX: 0, shadowColor: 'rgba(0, 0, 0, 0.5)' } } } ] }) });调用所有的函数
讯享网window.onresize = function() { saleM.resize(); orderQ.resize(); grossM.resize(); discount.resize(); unitP.resize(); saleRate.resize(); saleMtop5.resize(); saleOrder.resize(); payWay.resize(); };
3.所有代码
// 销售金额 & 订单量 & 毛利润 & 售货机数量 & 购买用户数 $.get("data/无人售货机各特征数据.json").done(function (data) { //data = JSON.parse(data); saleT('saleM', '销售金额', 0, data.销售金额[0], data.销售金额[1], data.销售金额[2], '','#1779d9','rgba(23,121,217,0.6)'); saleT('orderQ', '订单量', 0, data.订单量[0], data.订单量[1], data.订单量[2], '','#30b761','rgba(48,183,97,0.5)'); saleT('grossM', '毛利润', 0, data.毛利润[0], data.毛利润[1], data.毛利润[2], '','#d04a4b','rgba(208,74,75,0.5)'); saleT('discount', '折扣额', 0, data.折扣额[0], data.折扣额[1], data.折扣额[2], '千','#ca841e','rgba(202,132,30,0.5)'); saleT('unitP', '客单价', 0, data.客单价[0], data.客单价[1], data.客单价[2], '','#00a7c2','rgba(0,167,194,0.5)'); }); /* *id: chart容器id; *title: 仪表盘名称 *min: 最小值 *max: 最大值 *val: 当前实际值 *tag: 目标值 *unit: 单位符号 *color1: 主轴颜色 */ var saleM = echarts.init(document.getElementById("saleM")); var orderQ = echarts.init(document.getElementById("orderQ")); var grossM = echarts.init(document.getElementById("grossM")); var discount = echarts.init(document.getElementById("discount")); var unitP = echarts.init(document.getElementById("unitP")); function saleT(id, title, min, max, val, tag, unit, color1, color2) { var myChart = echarts.init(document.getElementById(id)); option = { tooltip: { confine:true, trigger: 'item', formatter:function(data){ hbl = (data.value/tag).toFixed(2); return title + ":" + data.value + '<br/>' + name + ":" + hbl } }, series: [{ startAngle: 180, endAngle: 0, splitNumber: 1, name: title, type: 'gauge', radius: '100%', axisLine: { lineStyle: { color: [ [0.25, '#1779da'], [0.5, '#1779da'], [1, '#ddd'] ], width: 20 } }, axisTick: { show: false }, axisLabel: { distance:0, width:30, height:24, lineHeight:24, padding:[25,-30,0], color:'rgba(255,255,255,0.5)', formatter: function (value) { if(unit=='千'){ return (value/1000).toFixed(1) + ' ' + unit; }else if(unit=='万'){ return (value/10000).toFixed(1) + ' ' + unit; }else{ return value; } } }, splitLine: { show: false }, pointer: { show:false, width: 3 }, title: { offsetCenter: [0, '92%'], color:'rgba(255,255,255,0.7)' }, detail: { offsetCenter: [0, '-10%'], formatter: function(value){ value1 = value / tag; return '{a|' + value.toFixed(1) + '}'; }, rich: { a: { fontSize:'16', fontWeight:'bold' } } }, data: [{}] }] }; option.series[0].min = min; option.series[0].max = max; option.series[0].data[0].value = val; option.series[0].axisLine.lineStyle.color[0][0] = (tag - min) / (max - min); option.series[0].axisLine.lineStyle.color[0][1] = color2; option.series[0].axisLine.lineStyle.color[1][0] = (val - min) / (max - min); option.series[0].axisLine.lineStyle.color[1][1] = color1; myChart.setOption(option); } //销售金额变化趋势 //初始化图表 var saleRate = echarts.init(document.getElementById('saleRate')); //设置图表option值 $.get("data/售货机销售金额及其环比增长率.json").done(function (data) { //data = JSON.parse(data); saleRate.setOption({ tooltip: { trigger: 'axis', axisPointer: { type: 'cross' } }, grid: { //用网格定位图表四边留空及顶部避开标题位置 x: 10, y: 50, x2: 10, y2: 10, //使坐标轴数据能完整显示 containLabel: true }, //设置legend位置及数据,位于图表右上方 legend: { data:['销售金额','销售金额环比增长率'], top: 10 }, barCategoryGap:'40%', xAxis: [ { type: 'category', //日期数据 data: data.日期, axisPointer: { type: 'shadow' }, //运用eCharts内置方法格式化日期,使x轴日期数据更简洁,同时不影响原数据在鼠标交互时的完整展现 axisLabel: { formatter: function(value){ return echarts.format.formatTime('dd', value); } } } ], yAxis: [ { type: 'value', name: '销售金额(元)', //设置Y坐标轴最小值 min: 0, //设置Y坐标轴最大值 max: 15000, //设置Y坐标轴值间隔值 interval: 5000 }, //定义Y轴右侧坐标轴 { type: 'value', name: '环比增长率(%)', min: -0.5, max: 1, interval: 0.5 } ], series: [ { name:'销售金额', type:'bar', //设置显示坐标点数值 label:{ show:'true' }, //销售金额数据 data:data.销售金额 }, { name:'销售金额环比增长率', type:'line', //设置“销售金额环比增长率”数值样式,圆角矩形黑底白字,位于数据点上方 label:{ //设置显示坐标点数值 show:'true', color:'#fff', backgroundColor:'rgba(0,0,0,0.7)', verticalAlign:'middle', padding:4, borderRadius:4, position:'top' }, //设置“销售金额环比增长率”在坐标轴右侧显示 yAxisIndex: 1, //销售金额环比增长率数据 data:data.销售金额环比增长率 } ] }) }); //商品销售金额Top5 var saleMtop5 = echarts.init(document.getElementById('saleMtop5')); $.get("data/商品销售金额前5名.json").done(function (data) { //data = JSON.parse(data); saleMtop5.setOption({ tooltip: { trigger: 'axis', axisPointer: { type: 'shadow' } }, grid: { x: 10, y: 20, x2: 10, y2: 10, containLabel: true }, barCategoryGap:'40%', xAxis: { type: 'value', boundaryGap: [0, 0.01], axisLine:{lineStyle:{width:0}}, }, yAxis: { type: 'category', splitLine:{lineStyle:{width:0}}, data: data.商品名称 }, series: [ { name: '售出总数量', type: 'bar', label:{ position:'right', verticalAlign:'middle', }, data: data.销售金额 } ] }) }); //售货机销售情况 var saleOrder = echarts.init(document.getElementById('saleOrder')); $.get("data/不同地点售货机销售数据.json").done(function (data) { //data = JSON.parse(data); saleOrder.setOption({ tooltip: { trigger: 'axis', axisPointer: { type: 'cross', crossStyle: { color: '#999' } } }, grid: { x: 10, y: 50, x2: 10, y2: 10, containLabel: true }, toolbox: { show:false, feature: { dataView: {show: true, readOnly: false}, magicType: {show: true, type: ['line', 'bar']}, restore: {show: true}, saveAsImage: {show: true} } }, legend: { top:10 }, barGap:'10%', barCategoryGap:'35%', xAxis: [ { type: 'category', data: data.地点, axisPointer: { type: 'shadow' }, splitLine:{lineStyle:{width:0}}, } ], yAxis: [ { type: 'value', name: '', min: 0, axisLabel: { formatter: '{value}' }, axisLine:{lineStyle:{width:0}}, } ], series: [ { name:'销售金额', type:'bar', data:data.销售金额 }, { name:'订单量', type:'bar', data:data.订单量 }, { name:'毛利润', type:'bar', data:data.毛利润 } ] }) }); //支付方式占比 var payWay = echarts.init(document.getElementById('payWay')); $.get("data/不同支付方式用户人数.json").done(function (data) { //data = JSON.parse(data); payWay.setOption({ tooltip : { trigger: 'item', formatter: "{a} <br/>{b} : {c} ({d}%)" }, legend: { data: data.支付方式, orient:'vertical', left:0, top:"25%" }, grid: { left: '0%', right: '0%', bottom: '0%', containLabel: true }, series : [ { name: '支付方式占比', type: 'pie', radius : '62%', center: ['65%', '50%'], label:{ formatter:"{b}\n{a|{d}%}", rich: { a: { padding:6, align:'left', color:'#999', } } }, data:data.data, itemStyle: { emphasis: { shadowBlur: 10, shadowOffsetX: 0, shadowColor: 'rgba(0, 0, 0, 0.5)' } } } ] }) }); window.onresize = function() { saleM.resize(); orderQ.resize(); grossM.resize(); discount.resize(); unitP.resize(); saleRate.resize(); saleMtop5.resize(); saleOrder.resize(); payWay.resize(); };三、可视化展现销售分析
1.整体效果呈现
2.代码实现
a:销售金额&订单量&毛利润&客单价平均值(南丁格尔玫瑰图)
南丁格尔玫瑰图是将柱状图 转化为更美观的饼图形式,是极坐标化的柱状图 。不同于饼图用角度表现数值或占比,南丁格尔玫瑰图使用扇形的半径表示数据的大小。为了方便对比分析不同区域无人售货机的销售情况,可以使用南丁格尔玫瑰图对各区域无人售货机的销售金额、订单量、客单价等指标进行可视化展示。
1)初始化,设置option值
讯享网var saleM_Site = echarts.init(document.getElementById('saleM_Site')); $.get("data/不同区域的各指标数据.json").done(function (data) { //data = JSON.parse(data), saleM_Site.setOption({ tooltip : { trigger: 'item', formatter: "{b}:<br/>{c} 元<br/>({d}%)" },
2)设置了类型为饼图类型,且圆形的center设置他的饼图的中心(圆心)坐标,数组的第一项是横坐标,第二项是纵坐标,和内圆心及设置为南丁格尔图然后文本标签(lable)设置为显示之后同上异步数据即可完成南丁格尔图
series : [ { name:'地点', type:'pie', radius : ["25%", '60%'], center : ['50%', '57%'], roseType : 'area', label:{ show:true, formatter:'{c}' }, data:data.sale }, { type:'pie',radius:'25%',center:['50%','57%'], label: {normal:{position:'center',color:'#fff'}}, labelLine:{normal:{show:false}},itemStyle:{color:'transparent'}, data:[{value:1,name:'地点',tooltip:{formatter:' ',backgroundColor:'none'}}] }, ]b:销售金额预测值与实际值(折线图)
同理于销售金额变化趋势(双y轴)
c:商品价格区间(散点图)
1)设置了滚动
讯享网legend: { type:'scroll',
2)
xAxis:是否是脱离 0 值比例。设置成 true 后坐标刻度不会强制包含零刻度。在双数值轴的散点图中比较有用
yAxis:是否是脱离 0 值比例。设置成 true 后坐标刻度不会强制包含零刻度。在双数值轴的散点图中比较有用,且只在数值轴中(type: 'value')有效
xAxis :{ scale:true}, yAxis :{ scale:true},3)异步数据同步到散点图中即可实现散点图的绘制
讯享网 var series=[]; for(var i = 0;i < data.data.length;i++){ series.push({ name: data.data[i].name, type: 'scatter', data: [data.data[i].value], symbolSize:data.data[i].value[1]*2 }); } priceRange.setOption({ series:series }); });
d:商品销售数量Top10(条形图)
同理于商品销售金额Top5(条形图)
3.所有代码
// 销售金额 var saleM_Site = echarts.init(document.getElementById('saleM_Site')); $.get("data/不同区域的各指标数据.json").done(function (data) { //data = JSON.parse(data), saleM_Site.setOption({ tooltip : { trigger: 'item', formatter: "{b}:<br/>{c} 元<br/>({d}%)" }, legend: { type:'scroll', data:data.where }, toolbox: { show : false, feature : { mark : {show: true}, dataView : {show: true, readOnly: false}, magicType : { show: true, type: ['pie', 'funnel'] }, restore : {show: true}, saveAsImage : {show: true} } }, calculable : true, series : [ { name:'地点', type:'pie', radius : ["25%", '60%'], center : ['50%', '57%'], roseType : 'area', label:{ show:true, formatter:'{c}' }, data:data.sale }, { type:'pie',radius:'25%',center:['50%','57%'], label: {normal:{position:'center',color:'#fff'}}, labelLine:{normal:{show:false}},itemStyle:{color:'transparent'}, data:[{value:1,name:'地点',tooltip:{formatter:' ',backgroundColor:'none'}}] }, ] }) }); // 订单量 var orderQ_Site = echarts.init(document.getElementById('orderQ_Site')); $.get("data/不同区域的各指标数据.json").done(function (data) { //data = JSON.parse(data), orderQ_Site.setOption({ tooltip : { trigger: 'item', formatter: "{b}:<br/>{c} 个<br/>({d}%)" }, legend: { type:'scroll', data:data.where }, toolbox: { show : false, feature : { mark : {show: true}, dataView : {show: true, readOnly: false}, magicType : { show: true, type: ['pie', 'funnel'] }, restore : {show: true}, saveAsImage : {show: true} } }, calculable : true, series : [ { name:'地点', type:'pie', radius : ["25%", '60%'], center : ['50%', '57%'], roseType : 'area', label:{ show:true, formatter:'{c}' }, data:data.order }, { type:'pie',radius:'25%',center:['50%','57%'], label: {normal:{position:'center',color:'#fff'}}, labelLine:{normal:{show:false}},itemStyle:{color:'transparent'}, data:[{value:1,name:'地点',tooltip:{formatter:' ',backgroundColor:'none'}}] }, ] }) }); // 毛利润 var grossM_Site = echarts.init(document.getElementById('grossM_Site')); $.get("data/不同区域的各指标数据.json").done(function (data) { //data = JSON.parse(data), grossM_Site.setOption({ tooltip : { trigger: 'item', formatter: "{b}:<br/>{c} 元<br/>({d}%)" }, legend: { type:'scroll', data:data.where }, toolbox: { show : false, feature : { mark : {show: true}, dataView : {show: true, readOnly: false}, magicType : { show: true, type: ['pie', 'funnel'] }, restore : {show: true}, saveAsImage : {show: true} } }, calculable : true, series : [ { name:'地点', type:'pie', radius : ["25%", '60%'], center : ['50%', '57%'], roseType : 'area', label:{ show:true, formatter:'{c}' }, data:data.gross }, { type:'pie',radius:'25%',center:['50%','57%'], label: {normal:{position:'center',color:'#fff'}}, labelLine:{normal:{show:false}},itemStyle:{color:'transparent'}, data:[{value:1,name:'地点',tooltip:{formatter:' ',backgroundColor:'none'}}] }, ] }) }); // 客单价平均值 var unitP_Site = echarts.init(document.getElementById('unitP_Site')); $.get("data/不同区域的各指标数据.json").done(function (data) { //data = JSON.parse(data), unitP_Site.setOption({ tooltip : { trigger: 'item', formatter: "{b}:<br/>{c} 元<br/>({d}%)" }, legend: { type:'scroll', data:data.where }, toolbox: { show : false, feature : { mark : {show: true}, dataView : {show: true, readOnly: false}, magicType : { show: true, type: ['pie', 'funnel'] }, restore : {show: true}, saveAsImage : {show: true} } }, calculable : true, series : [ { name:'地点', type:'pie', radius : ["25%", '60%'], center : ['50%', '57%'], roseType : 'area', label:{ show:true, formatter:'{c}' }, data:data.unit }, { type:'pie',radius:'25%',center:['50%','57%'], label: {normal:{position:'center',color:'#fff'}}, labelLine:{normal:{show:false}},itemStyle:{color:'transparent'}, data:[{value:1,name:'地点',tooltip:{formatter:' ',backgroundColor:'none'}}] }, ] }) }); // 商品销售数量Top10 var saleMtop10 = echarts.init(document.getElementById('saleMtop10')); $.get("data/商品销售数量前10.json").done(function (data) { //data = JSON.parse(data), saleMtop10.setOption({ tooltip: { trigger: 'axis', axisPointer: { type: 'shadow' } }, grid: { left: '0%', top:'20', right:'2%', bottom: '10', containLabel: true }, barCategoryGap:'40%', xAxis: { type: 'value', min: 0, interval: 5, boundaryGap: [0, 0.01], axisLine:{lineStyle:{width:0}}, }, yAxis: { type: 'category', splitLine:{lineStyle:{width:0}}, data: data.商品名称 }, series: [ { name: '售出总数量', type: 'bar', label:{ position:'right', verticalAlign:'middle', }, data: data.销售数量 } ] }) }); // 商品价格区间 var priceRange = echarts.init(document.getElementById('priceRange')); $.get("data/商品销量数量和价格数据.json").done(function (data) { //data = JSON.parse(data), priceRange.setOption({ grid: { left: '3%', right: '10', bottom: '10', containLabel: true }, tooltip : { showDelay : 0, formatter : function (params) { return params.seriesName + '<br/>' + '单价:' + params.value[0] + '<br/>' + '销量:' + params.value[1]; }, axisPointer:{ show: true, type : 'cross', lineStyle: { type : 'dashed', width : 1 } } }, legend: { type:'scroll', }, xAxis :{ scale:true}, yAxis :{ scale:true}, }) }); $.get("data/商品销量数量和价格数据.json").done(function (data) { //data = JSON.parse(data); var series=[]; for(var i = 0;i < data.data.length;i++){ series.push({ name: data.data[i].name, type: 'scatter', data: [data.data[i].value], symbolSize:data.data[i].value[1]*2 }); } priceRange.setOption({ series:series }); }); // 销售金额预测值与实际值 var saleAll = echarts.init(document.getElementById('saleAll')); $.get("data/销售金额实际值与预测值.json").done(function (data) { //data = JSON.parse(data), saleAll.setOption({ tooltip: { trigger: 'axis' }, legend: { type:'scroll' }, grid: { left: '10', right: '20', bottom: '10', containLabel: true }, xAxis: { type: 'category', boundaryGap: false, data: ['1日','2日','3日','4日','5日','6日','7日','8日','9日','10日', '11日','12日','13日','14日','15日','16日','17日','18日','19日','20日','21日','22日'] }, yAxis: { type: 'value', name: '金额(万元)', axisLabel: { formatter: '{value}' } }, series: [ { name:'销售金额实际值', type:'line', data:data.T, areaStyle: { normal: { color: new echarts.graphic.LinearGradient(0, 0, 0, 1, [{ offset: 0, color: 'rgba(194, 53, 49,.8)' }, { offset: 1, color: 'transparent' }]) } }, }, { type:'line', name:'销售金额预测值', data:data.Y, areaStyle:{ normal: { color: new echarts.graphic.LinearGradient(0, 0, 0, 1, [{ offset: 0, color: 'rgba(47, 69, 84,.4)' }, { offset: 1, color: 'transparent' }]) } } }, ] }) }); window.onresize = function() { saleM_Site.resize(); orderQ_Site.resize(); grossM_Site.resize(); unitP_Site.resize(); saleMtop10.resize(); priceRange.resize(); saleAll.resize(); }四、可视化展现库存分析
1.整体效果呈现
2.代码实现
a:商品存货周转天数(矩形树图)
1)初始化图表
讯享网var formatUtil = echarts.format; var turnaround = echarts.init(document.getElementById('turnaround'));
2)设置option值
$.get("data/各类商品存货周转天数.json").done(function (data) { //data = JSON.parse(data), turnaround.setOption({ tooltip:{ formatter: '{b}:{c}' },3)series设置图表标题位置的属性 内边距,设置标签的填充,对齐方式以及颜色
讯享网series: [{ type: 'treemap', label:{ show:true, position:'insideTopLeft', distance:0, padding:10, formatter:"{b}\n{a|{c}}", rich: { a: { padding:6, align:'right', verticalAlign:'bottom', color:'#fff', } } },
4)创建对象的属性
roam:false, nodeClick:false, breadcrumb:{show:false}, itemStyle:{ gapWidth:5, borderColor:'transparent' },b:设备容量(柱状堆积)
1)初始化图表
讯享网var mVolume = echarts.init(document.getElementById('mVolume'));
2)设置option值
mVolume.setOption({ tooltip: { trigger: 'axis' },3)设置legend类型,调整间距和宽度
讯享网 barWidth:'35%', barCategoryGap:'40%', grid: { left: '10', right: '20', bottom: '10', containLabel: true },
4)设置x、y轴,并实现堆积柱状
xAxis: { type: 'category', data: data.地点 }, yAxis: { type: 'value', }, series: [ { name:'库存总量', type:'bar', stack: '总量', label:{ position:'insideTop', padding:[5,0,0,0] }, data:data.库存数量, }, { type:'line', name:'预警线', connectNulls: 'true', data:[150,150,150,150,150], }, { name:'缺货总量', type:'bar', stack: '总量', label:{ position:'insideTop', padding:[5,0,0,0] }, itemStyle:{ color:'#ca841e' }, data:data.缺货数量, } ] }) });c:存销量(条形堆积)
同理于设备容量(柱状堆积),只需要调换x,y轴
d:滞销商品(双y轴)
同理于销售金额变化趋势(双y轴)
e:品类库存占比(圆环饼图)
1)初始化图表
讯享网var categoryStock = echarts.init(document.getElementById('categoryStock'));
2)设置option值
$.get("data/不同类型的商品库存数量.json").done(function (data) { //data = JSON.parse(data), categoryStock.setOption({ tooltip: { trigger: 'item', formatter: "{a} <br/>{b}: {c} ({d}%)" },3)设置图例legend
讯享网 legend: { orient: 'vertical', data:data.类型, left: 10, top: 20, },
4)设置series设置图表标题位置的属性 内边距,设置标签的填充,对齐方式以及颜色,实则就是圆环和饼图的结合
series: [ { name:'品类', type:'pie', radius: [0, '40%'], center : ['55%', '53%'], label: { normal: { position: 'inner' } }, labelLine: { normal: { show: false } }, data:data.一级商品 }, { name:'品类', type:'pie', color:['LimeGreen', 'DarkGreen', 'red', 'blue', 'Purple', 'DarkOrchid', 'Navy', '#061e42', 'black', '#4f8fa8'], radius: ['40%', '66%'], center : ['55%', '53%'], selectedMode: 'multiple', itemStyle:{ borderWidth:'2', borderColor:'none' }, label: { }, data:data.二级商品 } ] }) });3.所有代码
讯享网// 商品存货周转天数 var formatUtil = echarts.format; var turnaround = echarts.init(document.getElementById('turnaround')); $.get("data/各类商品存货周转天数.json").done(function (data) { //data = JSON.parse(data), turnaround.setOption({ tooltip:{ formatter: '{b}:{c}' }, series: [{ type: 'treemap', label:{ show:true, position:'insideTopLeft', distance:0, padding:10, formatter:"{b}\n{a|{c}}", rich: { a: { padding:6, align:'right', verticalAlign:'bottom', color:'#fff', } } }, roam:false, nodeClick:false, breadcrumb:{show:false}, itemStyle:{ gapWidth:5, borderColor:'transparent' }, data: data.data }] }) }); // 存销量 var stockSales = echarts.init(document.getElementById('stockSales')); $.get("data/商品库存数量和销售数量.json").done(function (data) { //data = JSON.parse(data), stockSales.setOption({ tooltip: { trigger: 'axis', axisPointer: { type: 'shadow' } }, grid: { left: '0%', top:'60', right:'5%', bottom: '10', containLabel: true }, barWidth:'45%', legend: { data:data.数量类型, top:'22' }, xAxis: { type: 'value', min: 0, boundaryGap: [0, 0.01], axisLine:{lineStyle:{width:0}}, }, yAxis: { type: 'category', splitLine:{lineStyle:{width:0}}, data: data.商品名称 }, series: [ { name: '销售数量', type: 'bar', stack: '数量', label:{ position:'insideRight', padding:[0,5,0,0], }, data: data.销售数量 }, { name: '库存数量', type: 'bar', stack: '数量', label:{ position:'insideRight', padding:[0,5,0,0], }, data: data.库存数量 } ] }) }); // 滞销商品 var unsalable = echarts.init(document.getElementById('unsalable')); $.get("data/商品滞销数据.json").done(function (data) { //data = JSON.parse(data), unsalable.setOption({ tooltip: { trigger: 'axis', axisPointer: { type: 'cross', crossStyle: { color: '#999' } } }, grid: { left: '10', right: '10', bottom: '10', containLabel: true }, toolbox: { show:false, feature: { dataView: {show: true, readOnly: false}, magicType: {show: true, type: ['line', 'bar']}, restore: {show: true}, saveAsImage: {show: true} } }, legend: { data:data.name }, barGap:'10%', barCategoryGap:'25%', xAxis: [ { type: 'category', data: data.商品名称, axisPointer:{type:'shadow'}, splitLine:{lineStyle:{width:0}}, axisLabel:{rotate:30} } ], yAxis: [ { type: 'value', name: '', min: 0, max: 500, interval: 100, axisLabel: { formatter: '{value}' }, axisLine:{lineStyle:{width:0}}, }, { type: 'value', name: '', min: 0, max: 1, interval: 0.2, axisLabel: { formatter: '{value} ' }, axisLine:{lineStyle:{width:0}}, } ], series: [ { name:'滞销金额', type:'bar', data:data.滞销金额 }, { name:'存货周转率', type:'line', yAxisIndex: 1, label:{ show:'true', color:'#fff', backgroundColor:'rgba(235,48,48,0.8)', verticalAlign:'middle', padding:[2,4,0,4], borderRadius:4, position:'inside' }, data:data.存货周转率 }, { name:'库存数量', type:'bar', data:data.库存数量 } ] }) }); //品类库存占比 var categoryStock = echarts.init(document.getElementById('categoryStock')); $.get("data/不同类型的商品库存数量.json").done(function (data) { //data = JSON.parse(data), categoryStock.setOption({ tooltip: { trigger: 'item', formatter: "{a} <br/>{b}: {c} ({d}%)" }, legend: { orient: 'vertical', data:data.类型, left: 10, top: 20, }, series: [ { name:'品类', type:'pie', radius: [0, '40%'], center : ['55%', '53%'], label: { normal: { position: 'inner' } }, labelLine: { normal: { show: false } }, data:data.一级商品 }, { name:'品类', type:'pie', color:['LimeGreen', 'DarkGreen', 'red', 'blue', 'Purple', 'DarkOrchid', 'Navy', '#061e42', 'black', '#4f8fa8'], radius: ['40%', '66%'], center : ['55%', '53%'], selectedMode: 'multiple', itemStyle:{ borderWidth:'2', borderColor:'none' }, label: { }, data:data.二级商品 } ] }) }); // 设备容量 var mVolume = echarts.init(document.getElementById('mVolume')); $.get("data/不同地点售货机库存数量和缺货数量.json").done(function (data) { //data = JSON.parse(data), mVolume.setOption({ tooltip: { trigger: 'axis' }, legend: { data:data.类型, type:'scroll', }, barWidth:'35%', barCategoryGap:'40%', grid: { left: '10', right: '20', bottom: '10', containLabel: true }, xAxis: { type: 'category', data: data.地点 }, yAxis: { type: 'value', }, series: [ { name:'库存总量', type:'bar', stack: '总量', label:{ position:'insideTop', padding:[5,0,0,0] }, data:data.库存数量, }, { type:'line', name:'预警线', connectNulls: 'true', data:[150,150,150,150,150], }, { name:'缺货总量', type:'bar', stack: '总量', label:{ position:'insideTop', padding:[5,0,0,0] }, itemStyle:{ color:'#ca841e' }, data:data.缺货数量, } ] }) }); window.onresize = function() { turnaround.resize(); stockSales.resize(); unsalable.resize(); categoryStock.resize(); mVolume.resize(); }
五、可视化展示用户分析
1.整体效果呈现
3.所有代码
// 商品存货周转天数 var formatUtil = echarts.format; var turnaround = echarts.init(document.getElementById('turnaround')); $.get("data/各类商品存货周转天数.json").done(function (data) { //data = JSON.parse(data), turnaround.setOption({ tooltip:{ formatter: '{b}:{c}' }, series: [{ type: 'treemap', label:{ show:true, position:'insideTopLeft', distance:0, padding:10, formatter:"{b}\n{a|{c}}", rich: { a: { padding:6, align:'right', verticalAlign:'bottom', color:'#fff', } } }, roam:false, nodeClick:false, breadcrumb:{show:false}, itemStyle:{ gapWidth:5, borderColor:'transparent' }, data: data.data }] }) }); // 存销量 var stockSales = echarts.init(document.getElementById('stockSales')); $.get("data/商品库存数量和销售数量.json").done(function (data) { //data = JSON.parse(data), stockSales.setOption({ tooltip: { trigger: 'axis', axisPointer: { type: 'shadow' } }, grid: { left: '0%', top:'60', right:'5%', bottom: '10', containLabel: true }, barWidth:'45%', legend: { data:data.数量类型, top:'22' }, xAxis: { type: 'value', min: 0, boundaryGap: [0, 0.01], axisLine:{lineStyle:{width:0}}, }, yAxis: { type: 'category', splitLine:{lineStyle:{width:0}}, data: data.商品名称 }, series: [ { name: '销售数量', type: 'bar', stack: '数量', label:{ position:'insideRight', padding:[0,5,0,0], }, data: data.销售数量 }, { name: '库存数量', type: 'bar', stack: '数量', label:{ position:'insideRight', padding:[0,5,0,0], }, data: data.库存数量 } ] }) }); // 滞销商品 var unsalable = echarts.init(document.getElementById('unsalable')); $.get("data/商品滞销数据.json").done(function (data) { //data = JSON.parse(data), unsalable.setOption({ tooltip: { trigger: 'axis', axisPointer: { type: 'cross', crossStyle: { color: '#999' } } }, grid: { left: '10', right: '10', bottom: '10', containLabel: true }, toolbox: { show:false, feature: { dataView: {show: true, readOnly: false}, magicType: {show: true, type: ['line', 'bar']}, restore: {show: true}, saveAsImage: {show: true} } }, legend: { data:data.name }, barGap:'10%', barCategoryGap:'25%', xAxis: [ { type: 'category', data: data.商品名称, axisPointer:{type:'shadow'}, splitLine:{lineStyle:{width:0}}, axisLabel:{rotate:30} } ], yAxis: [ { type: 'value', name: '', min: 0, max: 500, interval: 100, axisLabel: { formatter: '{value}' }, axisLine:{lineStyle:{width:0}}, }, { type: 'value', name: '', min: 0, max: 1, interval: 0.2, axisLabel: { formatter: '{value} ' }, axisLine:{lineStyle:{width:0}}, } ], series: [ { name:'滞销金额', type:'bar', data:data.滞销金额 }, { name:'存货周转率', type:'line', yAxisIndex: 1, label:{ show:'true', color:'#fff', backgroundColor:'rgba(235,48,48,0.8)', verticalAlign:'middle', padding:[2,4,0,4], borderRadius:4, position:'inside' }, data:data.存货周转率 }, { name:'库存数量', type:'bar', data:data.库存数量 } ] }) }); //品类库存占比 var categoryStock = echarts.init(document.getElementById('categoryStock')); $.get("data/不同类型的商品库存数量.json").done(function (data) { //data = JSON.parse(data), categoryStock.setOption({ tooltip: { trigger: 'item', formatter: "{a} <br/>{b}: {c} ({d}%)" }, legend: { orient: 'vertical', data:data.类型, left: 10, top: 20, }, series: [ { name:'品类', type:'pie', radius: [0, '40%'], center : ['55%', '53%'], label: { normal: { position: 'inner' } }, labelLine: { normal: { show: false } }, data:data.一级商品 }, { name:'品类', type:'pie', color:['LimeGreen', 'DarkGreen', 'red', 'blue', 'Purple', 'DarkOrchid', 'Navy', '#061e42', 'black', '#4f8fa8'], radius: ['40%', '66%'], center : ['55%', '53%'], selectedMode: 'multiple', itemStyle:{ borderWidth:'2', borderColor:'none' }, label: { }, data:data.二级商品 } ] }) }); // 设备容量 var mVolume = echarts.init(document.getElementById('mVolume')); $.get("data/不同地点售货机库存数量和缺货数量.json").done(function (data) { //data = JSON.parse(data), mVolume.setOption({ tooltip: { trigger: 'axis' }, legend: { data:data.类型, type:'scroll', }, barWidth:'35%', barCategoryGap:'40%', grid: { left: '10', right: '20', bottom: '10', containLabel: true }, xAxis: { type: 'category', data: data.地点 }, yAxis: { type: 'value', }, series: [ { name:'库存总量', type:'bar', stack: '总量', label:{ position:'insideTop', padding:[5,0,0,0] }, data:data.库存数量, }, { type:'line', name:'预警线', connectNulls: 'true', data:[150,150,150,150,150], }, { name:'缺货总量', type:'bar', stack: '总量', label:{ position:'insideTop', padding:[5,0,0,0] }, itemStyle:{ color:'#ca841e' }, data:data.缺货数量, } ] }) }); window.onresize = function() { turnaround.resize(); stockSales.resize(); unsalable.resize(); categoryStock.resize(); mVolume.resize(); }2.代码实现
a:近5日用户人数新增和流失趋势(折线图)
同理于销售金额变化趋势(双y轴)
b:用户类型人数(圆环图)
同理于品类库存占比(圆环饼图)
c: 用户分群(雷达图)
1)设置了center即的中心(圆心)坐标,数组的第一项是横坐标,第二项是纵坐标
讯享网center: ['50%', '58%'], splitArea: { areaStyle: { color:'transparent' } },
2)indicator设置了雷达图的五个点的名称和最大值及颜色
type:设置了为雷达图的类型
data:异步数据同步完成雷达图的设置
axisLine: { lineStyle: {color: '#061e42' }}, splitLine: { lineStyle: {color: '#061e42' }}, indicator: [ { name: '消费金额', max: 80,color:'black'}, { name: '购买数量', max: 80,color:'black'}, { name: '购买频率', max: 80,color:'black'}, { name: '交易次数', max: 80,color:'black'}, { name: '客单价', max: 80,color:'black' } ] }, series: [{ name: '用户分群', type: 'radar', areaStyle:{ show:true, opacity:0.3 }, data : data.data }] }) });d:用户消费时段(条形图)
同理于商品销售金额Top5(条形图)
e:用户消费地点(柱状图)
同理于售货机销售情况(柱状图)
f:商品价格区间(散点图)
同理于商品价格区间(散点图)
g:用户画像(词云图)
1)这里设置了type类型为词云图和大小区间为10到30,词云词语位置居中,宽度和高度都100%
right和bottom为空
讯享网 type: 'wordCloud', sizeRange: [10,30], rotationRange: [0, 0], rotationStep: 180, gridSize: 0, autoSize: {enable:true, minSize:5}, shape: 'roundRect', left: 'center', top: 'center', width: '100%', height: '100%', right: null, bottom: null,
2)设置的文字样式,颜色和字体大小等等
textStyle: { normal: { color: function () { return 'rgb(' + [ Math.round(Math.random() * 160), Math.round(Math.random() * 160), Math.round(Math.random() * 160) ].join(',') + ')'; } }, emphasis: { shadowBlur: 26, color:'#333', shadowColor: '#ccc', fontSize:20 } },3.所有代码
讯享网// 近5日用户人数新增和流失趋势 var lossGrowth = echarts.init(document.getElementById('lossGrowth')); $.get("data/近5日新增和流失用户数据.json").done(function (data) { //data = JSON.parse(data); lossGrowth.setOption({ tooltip: { trigger: 'axis' }, legend: { type:'scroll' }, grid: { left: '10', right: '30', bottom: '10', containLabel: true }, xAxis: { type: 'category', boundaryGap: false, data: data.日期 }, yAxis: { type: 'value' }, series: [ { name:'新增人数', type:'line', data:data.新增人数, symbol:'circle', areaStyle: { normal: { color: new echarts.graphic.LinearGradient(0, 0, 0, 1, [{ offset: 0, color: 'rgba(194, 53, 49,.8)' }, { offset: 1, color: 'transparent' }]) } } }, { name:'流失人数', type:'line', symbol:'circle', data:data.流失人数, areaStyle: { normal: { color: new echarts.graphic.LinearGradient(0, 0, 0, 1, [{ offset: 0, color: 'rgba(47, 69, 84,.8)' }, { offset: 1, color: 'transparent' }]) } } } ] }); }); //用户类型人数 var cSorNum = echarts.init(document.getElementById('cSorNum')); $.get("data/不同类型用户的人数.json").done(function (data) { //data = JSON.parse(data); cSorNum.setOption({ tooltip : { trigger: 'item', formatter: "{a} <br/>{b} : {c} ({d}%)" }, legend: { show:false }, grid: { left: '0%', right: '0%', bottom: '0%', containLabel: true }, series : [ { name: '用户类型人数', type: 'pie', radius: ['40%', '70%'], center: ['50%', '50%'], label:{ formatter:"{b}\n{a|{d}%}", rich: { a: { padding:6, align:'left', color:'#fff' } } }, data:data.data, itemStyle: { emphasis: { shadowBlur: 10, shadowOffsetX: 0, shadowColor: 'rgba(0, 0, 0, 0.5)' } } } ] }) }); // 用户分群 var userGroup = echarts.init(document.getElementById('userGroup')); $.get("data/用户分群数据.json").done(function (data) { //data = JSON.parse(data); userGroup.setOption({ tooltip: {}, legend: { }, radar: { name: { textStyle: { color: '#fff', borderRadius: 3, padding: [3, 5] } }, center: ['50%', '58%'], splitArea: { areaStyle: { color:'transparent' } }, axisLine: { lineStyle: {color: '#061e42' }}, splitLine: { lineStyle: {color: '#061e42' }}, indicator: [ { name: '消费金额', max: 80,color:'black'}, { name: '购买数量', max: 80,color:'black'}, { name: '购买频率', max: 80,color:'black'}, { name: '交易次数', max: 80,color:'black'}, { name: '客单价', max: 80,color:'black' } ] }, series: [{ name: '用户分群', type: 'radar', areaStyle:{ show:true, opacity:0.3 }, data : data.data }] }) }); // 用户消费时段 var expTime = echarts.init(document.getElementById('expTime')); $.get("data/用户消费时段数据.json").done(function (data) { //data = JSON.parse(data); expTime.setOption({ tooltip: { trigger: 'axis', axisPointer: { type: 'shadow' } }, grid: { left: '10', top:'30', right:'10', bottom: '10', containLabel: true }, barCategoryGap:'50%', xAxis: { type: 'value', min: 0, boundaryGap: [0, 0.01], axisLine:{lineStyle:{width:0}} }, yAxis: { type: 'category', splitLine:{lineStyle:{width:0}}, data: data.消费时段 }, series: [ { name: '售出总数量', type: 'bar', label:{ position:'right', verticalAlign:'middle' }, data: data.用户人数 } ] }) }); // 用户消费地点 var expLoc = echarts.init(document.getElementById('expLoc')); $.get("data/用户消费地点数据.json").done(function (data) { //data = JSON.parse(data), expLoc.setOption({ tooltip: { trigger: 'axis', }, grid: { left: '10', right: '10', bottom: '0', top:'30', containLabel: true }, barCategoryGap:'60%', xAxis: [ { type: 'category', data: data.消费地点, axisPointer: { type: 'shadow' }, splitLine:{lineStyle:{width:0}} } ], yAxis: [ { type: 'value', name: '', min: 0, } ], series: [ { type:'bar', data:data.用户人数, } ] }) }); // 商品价格区间 var pInterval = echarts.init(document.getElementById('pInterval')); pInterval.setOption({ grid: { left: '3%', right: '10', bottom: '10', containLabel: true }, tooltip : { showDelay : 0, formatter : function (params) { return params.seriesName + '<br/>' + '单价:' + params.value[0] + '<br/>' + '销量:' + params.value[1]; }, axisPointer:{ show: true, type : 'cross', lineStyle: { type : 'dashed', width : 1 } } }, legend: { type:'scroll', }, xAxis :{ scale:true}, yAxis :{ scale:true}, }); $.get("data/商品销量数量和价格数据.json").done(function (data) { //data = JSON.parse(data); var series=[]; for(var i = 0;i < data.data.length;i++){ series.push({ name: data.data[i].name, type: 'scatter', data: [data.data[i].value], symbolSize:data.data[i].value[1]*2 }); } pInterval.setOption({ series:series }); }); // 用户画像 var chart = echarts.init(document.getElementById('userHot')); $.get("data/用户购买的商品名称和商品数量数据.json").done(function (data) { //data = JSON.parse(data); var option = { tooltip : { trigger: 'item', formatter:function(item){ return item.name + ":" + item.value.toFixed(2); } }, series: [ { type: 'wordCloud', sizeRange: [10,30], rotationRange: [0, 0], rotationStep: 180, gridSize: 0, autoSize: {enable:true, minSize:5}, shape: 'roundRect', left: 'center', top: 'center', width: '100%', height: '100%', right: null, bottom: null, textStyle: { normal: { color: function () { return 'rgb(' + [ Math.round(Math.random() * 160), Math.round(Math.random() * 160), Math.round(Math.random() * 160) ].join(',') + ')'; } }, emphasis: { shadowBlur: 26, color:'#333', shadowColor: '#ccc', fontSize:20 } }, data: data.data.sort(function (a, b) { return b.value - a.value; }) } ] }; chart.setOption(option); }); window.onresize = function() { cSorNum.resize(); lossGrowth.resize(); expTime.resize(); expLoc.resize(); pInterval.resize(); userGroup.resize(); chart.resize(); };
可视展示销售情况总分析可视化
可视化展示销售情况总分析
可视化展示销售情况总分析
版权声明:本文内容由互联网用户自发贡献,该文观点仅代表作者本人。本站仅提供信息存储空间服务,不拥有所有权,不承担相关法律责任。如发现本站有涉嫌侵权/违法违规的内容,请联系我们,一经查实,本站将立刻删除。
如需转载请保留出处:https://51itzy.com/kjqy/116200.html