
给地图标记点
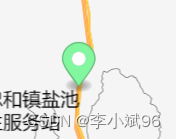
实现效果
讯享网
 / * 在地图上添加标记点 * point: [lng, lat] * color: '#83f7a0' */ addMarkerOnMap(point, color = '#83f7a0') {
    const marker = new mapboxgl.Marker({
    draggable: false, color: color, }).setLngLat(point).addTo(this.map); this.markersList.push(marker); },
讯享网
给地图添加气泡展示地点详情
实现效果:
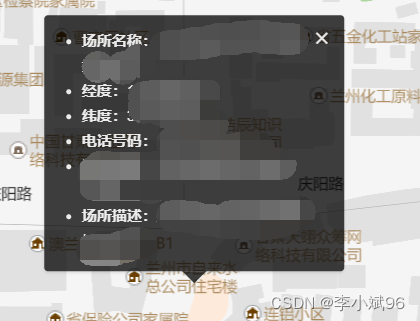
讯享网 / * 在地图上添加气泡展示 * point: [lng, lat] */ addPopupOnMap(point) {
    // 将所选点设置为地图中心 this.map.setCenter(point); // Zoom to the zoom level 8 with an animated transition this.map.zoomTo(16, {
    duration: 2000 }); // 自行赋值 const html = `<div class="dt-popup"> <i class="ivu-icon ivu-icon-md-close" id="closePop"></i> <ul> <li><span class="label">事件名称:</span>${
     eventName}</li> <li><span class="label">经度:</span>${
     longitude}</li> <li><span class="label">纬度:</span>${
     latitude}</li> </ul> </div>` const popup = new mapboxgl.Popup({
    closeOnClick: false }).setLngLat(point).setHTML(html).addTo(this.map); // this.popup = popup Popup = popup },
给地图划线
实现效果
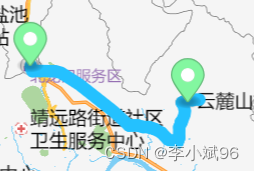
我的写法估计是有点问题,每条小线段都增加了一个资源和图层,但是还是实现了此功能
map.addSource(`route${
     routesI}`, {
    type: 'geojson', data: {
    type: 'Feature', properties: {
   }, geometry: {
    type: 'LineString', coordinates: routesNew, }, }, }); map.addLayer({
    id: `route${
     routesI}`, type: 'line', source: `route${
     routesI}`, layout: {
    'line-join': 'round', 'line-cap': 'round', }, paint: {
    'line-color': '#24C1FF', 'line-width': 10, }, });
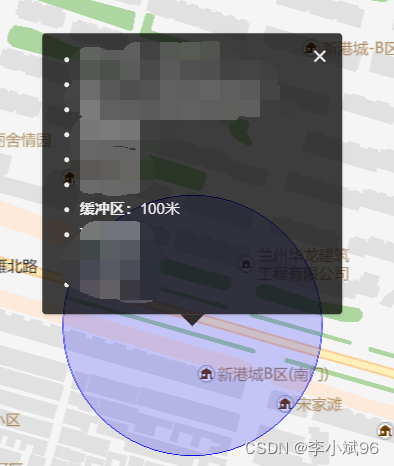
给地图添加缓冲区画圆
实现效果:(颜色自行修改)
参考地址:https://blog.csdn.net/_/article/details/
思路:画圆,其实就是连接n个近似于圆的点位。
经过验证,上述文章中选取了方法三,自定义去切割圆。方法一未曾实现。方法二可能有问题,没有尝试。
讯享网/ * 计算以中心点、半径 缓冲区 * center: [lng, lat] * radiusInKm */ createGeoJSONCircle(center, radiusInM, points = 64) {
    var coords = {
    latitude: center[1], longitude: center[0] }; var miles = radiusInM; var ret = []; var distanceX = miles/1000/(111.320*Math.cos(coords.latitude*Math.PI/180)); var distanceY = miles/1000/110.574; var theta, x, y; for(var i=0; i<points; i++) {
    theta = (i/points)*(2*Math.PI); x = distanceX*Math.cos(theta); y = distanceY*Math.sin(theta); ret.push([coords.longitude+x, coords.latitude+y]); } ret.push(ret[0]); return {
    "type": "geojson", "data": {
    "type": "FeatureCollection", "features": [{
    "type": "Feature", "geometry": {
    "type": "Polygon", "coordinates": [ret] } }] } }; }, / 调用 - 请自行赋值 */ map.addSource("polygon", createGeoJSONCircle([-93., 41.], 0.5)); map.addLayer({
    "id": "polygon", "type": "fill", "source": "polygon", "layout": {
   }, "paint": {
    "fill-color": "blue", "fill-opacity": 0.6 } });
给地图添加其他图片资源
实现效果
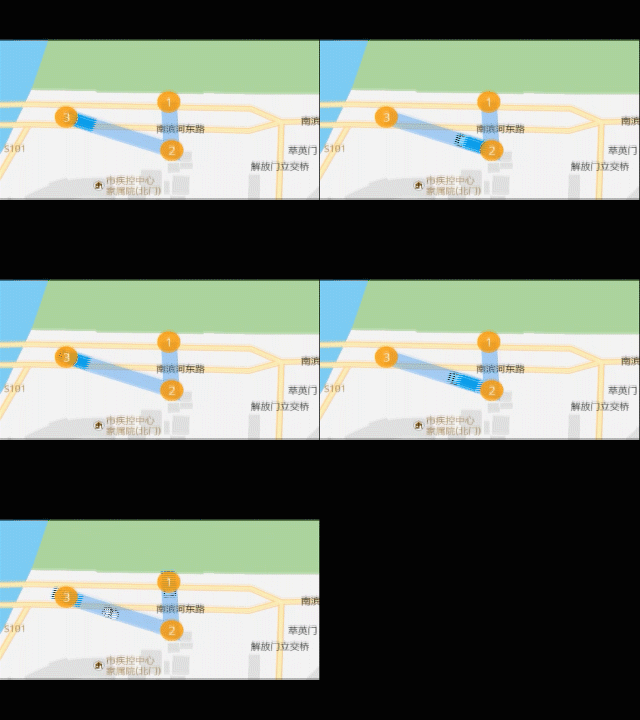
添加卡车图片资源:

 / * 引入图片 * img obj : src, name */ addImage = function(img) {
    map.loadImage(img.src, (error, image) => {
    if (error) throw error; if (!map.hasImage(img.name)) map.addImage(img.name, image, {
    sdf: img.sdf || false }); }) } // 加载 truck  let truck_img = {
    src: 'img/truck_mapboxgl.png', name: 'truck_img' } addImage(truck_img)
给地图添加图上gif中 1-2-3标记点并且实现鼠标滑过显示popup效果
实现效果:同上图
讯享网/ * 添加坐标点及鼠标以上效果 */ addPoints = function (featuresList) {
    map.addSource('places', {
    'type': 'geojson', 'data': {
    'type': 'FeatureCollection', 'features': featuresList } }) // 加载 circle 定位圆 let img = {
    src: 'img/circle.png', name: 'circle_img', sdf: true } addImage(img) map.addLayer({
    'id': 'places', 'type': 'symbol', 'source': 'places', 'layout': {
    'icon-image': img.name, // 图标ID 'icon-size': 0.15, // 图标的大小 'icon-anchor': 'center', // 图标的位置 'text-field': ['get', 'num'], }, 'paint': {
    'text-color': '#fff', 'icon-color': ['get', 'color'] }, }); // Create a popup, but don't add it to the map yet. const popup = new mapboxgl.Popup({
    closeButton: false, closeOnClick: false }); map.on('mouseenter', 'places', (e) => {
    // Change the cursor style as a UI indicator. map.getCanvas().style.cursor = 'pointer'; // Copy coordinates array. const coordinates = e.features[0].geometry.coordinates.slice(); const description = e.features[0].properties.description; // Ensure that if the map is zoomed out such that multiple // copies of the feature are visible, the popup appears // over the copy being pointed to. while (Math.abs(e.lngLat.lng - coordinates[0]) > 180) {
    coordinates[0] += e.lngLat.lng > coordinates[0] ? 360 : -360; } // Populate the popup and set its coordinates // based on the feature found. popup.setLngLat(coordinates).setHTML(description).addTo(map); }); map.on('mouseleave', 'places', () => {
    map.getCanvas().style.cursor = ''; popup.remove(); }); }
在地图中图标动态移动
实现效果:如上图
此方法用于卡车图标动态移动
/ * 添加路径 - 卡车图标动态效果 */ addTruckRoutes = function (coordinatesList) {
    // 起点 const origin = coordinatesList[0] const route = {
    'type': 'FeatureCollection', 'features': [{
    'type': 'Feature', 'geometry': {
    'type': 'LineString', 'coordinates': coordinatesList } }] }; const point = {
    'type': 'FeatureCollection', 'features': [{
    'type': 'Feature', 'properties': {
   }, 'geometry': {
    'type': 'Point', 'coordinates': origin } }] } const lineDistance = turf.length(route.features[0]); const arc = []; const steps = 200; for (let i = 0; i < lineDistance; i += lineDistance / steps) {
    const segment = turf.along(route.features[0], i); arc.push(segment.geometry.coordinates); } route.features[0].geometry.coordinates = arc; let counter = 0; map.addSource('route', {
    'type': 'geojson', 'data': route }); map.addSource('point', {
    'type': 'geojson', 'data': point }); map.addLayer({
    'id': `route`, 'source': 'route', 'type': 'line', 'paint': {
    'line-width': 20, 'line-color': '#2d8cf0', 'line-opacity': 0.4 } }) // 加载 truck 定位圆 let truck_img = {
    src: 'img/truck_mapboxgl.png', name: 'truck_img' } addImage(truck_img) map.addLayer({
    'id': `point`, 'source': 'point', 'type': 'symbol', 'layout': {
    'icon-image': truck_img.name, 'icon-size': 0.2, 'icon-rotate': ['get', 'bearing'], 'icon-rotation-alignment': 'map', 'icon-allow-overlap': true, 'icon-ignore-placement': true } }); animate = function () {
    running = true; const start = route.features[0].geometry.coordinates[ counter >= steps ? counter - 1 : counter ]; const end = route.features[0].geometry.coordinates[ counter >= steps ? counter : counter + 1 ]; point.features[0].geometry.coordinates = route.features[0].geometry.coordinates[counter]; point.features[0].properties.bearing = turf.bearing( turf.point(start), turf.point(end) )+90; // 此处控制图标的头部指向问题,可以加减角度,使卡车头部一直朝着目的地 // Update the source with this new data map.getSource('point').setData(point); // Request the next frame of animation as long as the end has not been reached if (counter < steps) {
    requestAnimationFrame(animate); counter = counter + 1; } else {
    counter = 0 animate() } } animate(counter); }
地图路线持续闪动特效
实现效果
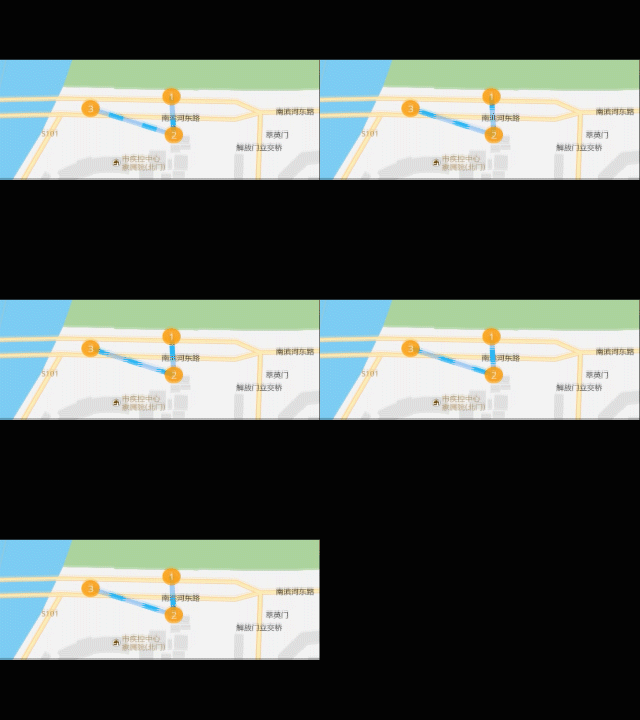
此方法官网有示例
代码如下:
讯享网/ * 添加路径 - 路径虚线变化效果 */ addDashedRoutes = function (coordinatesList) {
    map.addSource('route', {
    'type': 'geojson', 'data': {
    'type': 'Feature', 'properties': {
   }, 'geometry': {
    'type': 'LineString', 'coordinates': coordinatesList } } }); map.addLayer({
    'id': 'route', 'type': 'line', 'source': 'route', 'layout': {
    'line-join': 'round', 'line-cap': 'round' }, 'paint': {
    // 'line-color': '#2b85e4', // 'line-width': 10 'line-color': '#2d8cf0', 'line-width': 8, 'line-opacity': 0.4 } }); map.addLayer({
    id: 'line-dashed', type: 'line', source: 'route', paint: {
    'line-color': '#2db7f5', 'line-width': 8, 'line-dasharray': [0, 4, 3] } }); / * 动态展示路径 - 路径虚线变化效果 */ const dashArraySequence = [ [0, 4, 3], [0.5, 4, 2.5], [1, 4, 2], [1.5, 4, 1.5], [2, 4, 1], [2.5, 4, 0.5], [3, 4, 0], [0, 0.5, 3, 3.5], [0, 1, 3, 3], [0, 1.5, 3, 2.5], [0, 2, 3, 2], [0, 2.5, 3, 1.5], [0, 3, 3, 1], [0, 3.5, 3, 0.5] ]; let step = 0; animateDashArray = function (timestamp) {
    const newStep = parseInt( (timestamp / 50) % dashArraySequence.length ); if (newStep !== step) {
    map.setPaintProperty( 'line-dashed', 'line-dasharray', dashArraySequence[step] ); step = newStep; } // Request the next frame of the animation. requestAnimationFrame(animateDashArray); } // start the animation animateDashArray(0); }
地图正向反向地址匹配
官网有示例,可自行查阅
/ * 正向地址匹配 * address: '孵化大厦' */ addressMatchPoint(address) {
    // 正向匹配参数 var geoCodeParam = new SuperMap.GeoCodingParameter({
    address: address, // 地址 fromIndex:0, // 设置返回对象的起始索引值 toIndex:10, // 设置返回对象的结束索引值。 // prjCoordSys:{epsgcode26}, // 坐标设置 maxReturn:5 // 最大返回结果数 }); //创建地址匹配服务 var addressUrl = MAP_SERVICE + "*" var addressMatchService = new mapboxgl.supermap.AddressMatchService(addressUrl); // 向服务端发送请求进行正向地址匹配,并获取返回的结果 return addressMatchService.code(geoCodeParam, function(obj){
   }); }, / * 反向地址匹配 * point: [lng, lat] */ pointMatchAddress(point) {
    // 反向匹配参数 var geoDecodeParam = new SuperMap.GeoDecodingParameter({
    x: point[0], // 横坐标 y: point[1], // 纵坐标 fromIndex: 0, // 设置返回对象的起始索引值。 toIndex: 10, // 设置返回对象的结束索引值。 // filters: "", // 过滤字段 // prjCoordSys: {epsgcode26}, // 坐标设置 maxReturn: 3, // 最大结果数 geoDecodingRadius: -1 // 查询半径 }); // 创建地址匹配服务 var addressUrl = MAP_SERVICE + "*" var addressMatchService = new mapboxgl.supermap.AddressMatchService(addressUrl); // 向服务端发送请求进行反向地址匹配,并获取返回的结果 return addressMatchService.decode(geoDecodeParam, function(obj){
   }); },
两点之间路径规划
参照官网示例
讯享网let serviceUrl = MAP_SERVICE + ''; let findPathService = new mapboxgl.supermap.NetworkAnalystService(serviceUrl); //向服务器发送请求,并对返回的结果进行分析处理,展示在客户端上 const result = findPathService.findPath(findPathParams, function(serviceResult) {
   }) // ...不完整代码
遇到问题
- 在vue组件中,添加上了maker或者popup,使用data中定义变量会造成地图空白问题,暂时没有解决,后面改用在全局声明marker或者popup,layer好像也存在类似问题,可以参考解决。

- 调用以上方法包裹在
map.on('load', () => { })的方法中。 - 以上代码均为不完整代码,有些在vue中使用,有些在原生中使用,请仔细阅读,以免出错。
版权声明:本文内容由互联网用户自发贡献,该文观点仅代表作者本人。本站仅提供信息存储空间服务,不拥有所有权,不承担相关法律责任。如发现本站有涉嫌侵权/违法违规的内容,请联系我们,一经查实,本站将立刻删除。
如需转载请保留出处:https://51itzy.com/kjqy/74447.html