
效果
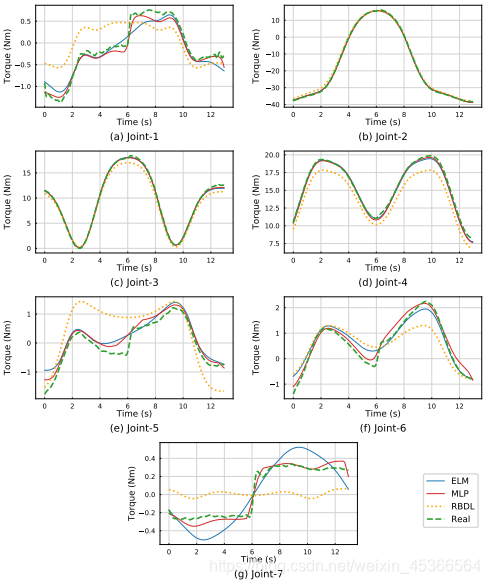
7张图,每行两张,最后一张位于中间
讯享网
方法
使用matplotlib.gridspec
- 分成四行四列

gs = gridspec.GridSpec(4, 4)
讯享网 - 每行第一张图占0,1 位;第二张图占2,3位;最后一行的图占1,2位
即:plt.subplot(gs[行, 列])讯享网
# position if (joint%2==0 and joint != 6): ax = plt.subplot(gs[int(joint/2), :2]) # 第一张图占0,1 位 elif (joint == 6): ax = plt.subplot(gs[int(joint/2), 1:3]) # 最后一行的图占1,2位 else: ax = plt.subplot(gs[int(joint/2), 2:]) # 第二张图占2,3位

完整代码
import matplotlib.gridspec as gridspec def show_results(robot_name, file_test_list, joint=None): joint_range = [] if joint is None:joint_range = range(0,7) else:joint_range = range(joint,joint+1) letter = list(map(chr, range(ord('a'), ord('z') + 1))) mlp_folder = robot_name+"_(50,50,20)" plt.figure(robot_name,figsize=(6,7.3)) gs = gridspec.GridSpec(4, 4) for joint in joint_range: elm_model = robot_ELM(joint) X_test, T_test = elm_model.loadData(file_test_list) ELM model = joblib.load(func.get_module_path("../../training_model/"+robot_name)+"/"+robot_name+"9-16,tanh,r=200/joint_"+str(joint)+".pickle") # model = joblib.load(func.get_module_path("../../training_model/param_selection/9-16,tanh")+"/"+robot_name+"/joint_"+str(joint)+".pickle") # model_sf = joblib.load(func.get_module_path("../../training_model/param_selection/9-16,tanh,sf/blue")+"/joint_"+str(joint)+".pickle") # model = joblib.load(func.get_module_path("../../training_model/param_selection/9-16,sigm,sf/blue")/joint_"+str(joint)+".pickle") MLP mlp = joblib.load(func.get_module_path("../../training_model/MLP/"+mlp_folder)+'/joint_'+str(joint)+'.pickle') # mlp_sf = joblib.load(func.get_module_path("../../training_model/MLP/"+mlp_folder)+',sf/joint_'+str(joint)+'.pickle') # mlp_nosf = joblib.load(func.get_module_path("../../training_model/MLP/"+mlp_folder)+',nosf/joint_'+str(joint)+'.pickle') Transfer learning Two-layer # model1 = joblib.load(func.get_module_path("../../training_model/trsf1")+"/trsf1_"+robot_name+"_bs_blue9-16,tanh,r=200,m=1/joint_"+str(joint)+".pickle") # model2 = joblib.load(func.get_module_path("../../training_model/trsf1")+"/trsf1_"+robot_name+"_bs_blue9-16,tanh,r=200,m=2/joint_"+str(joint)+".pickle") Three-layer # model1 = joblib.load(func.get_module_path("../../training_model/trsf2")+"/trsf2_"+robot_name+"_bs_blue_red9-16,tanh,r=100,m=1/joint_"+str(joint)+".pickle") # model2 = joblib.load(func.get_module_path("../../training_model/trsf2")+"/trsf2_"+robot_name+"_bs_blue_red9-16,tanh,r=100,m=2/joint_"+str(joint)+".pickle") O_test = model.predict(X_test) O_mlp = mlp.predict(X_test).reshape(-1,1) # plot position if (joint%2==0 and joint != 6): ax = plt.subplot(gs[int(joint/2), :2]) elif (joint == 6): ax = plt.subplot(gs[int(joint/2), 1:3]) else: ax = plt.subplot(gs[int(joint/2), 2:]) # if(joint == 6): ax = plt.subplot(3,3,joint+2) # else: ax = plt.subplot(3,3,joint+1) # plt.figure(robot_name+" Joint "+str(joint)) func.plot_figure(target=elm_model.get_tau_r_f(), elm=O_test+elm_model.get_tau_m(), rbdl=elm_model.get_tau_m(), mlp=O_mlp+elm_model.get_tau_m(), # shuffle=O_mlp_sf+elm_model.get_tau_m(), # shuffle=O_shuf+elm_model.get_tau_m(), # transfer_1=O_test1+elm_model.get_tau_m(), # transfer_2=O_test2+elm_model.get_tau_m(), fs=100, joint_i=None) plt.subplots_adjust(hspace=0.43,wspace=0.7) ax.set_xlabel("Time (s)",fontsize=6.5) ax.set_ylabel("Torque (Nm)",fontsize=6.5) ax.xaxis.set_label_coords(0.5, -0.11) ax.yaxis.set_label_coords(-0.12, 0.5) ax.tick_params(direction='in', axis="both", labelsize=5, width=0.5, length=1) plt.grid(b=True, which='major', color='lightgrey', linestyle='-', linewidth=0.4) for axis in ['top','bottom','left','right']: ax.spines[axis].set_linewidth(0.5) if joint == 6: plt.rcParams["mathtext.fontset"] = "cm" plt.rcParams['text.latex.preamble']=[r"\usepackage{lmodern}"] # leg = plt.legend(loc = "best", fontsize=5.5, framealpha=0.7) # leg.get_frame().set_linewidth(0.8) plt.legend(bbox_to_anchor=(1.62,0.71), borderaxespad = 0.2, fontsize=6.5) #loc='lower right' ax.set_title('('+letter[joint]+') '+'Joint-'+str(joint+1), y=-0.4, fontsize=7.5) savepath = "." plt.savefig(savepath, bbox_inches='tight') 参考
- matplotlib 画图
- Multiple Subplots
- Matplotlib: 3 plots plotted in 2 rows with single image centered
- GridSpec 官方教程
版权声明:本文内容由互联网用户自发贡献,该文观点仅代表作者本人。本站仅提供信息存储空间服务,不拥有所有权,不承担相关法律责任。如发现本站有涉嫌侵权/违法违规的内容,请联系我们,一经查实,本站将立刻删除。
如需转载请保留出处:https://51itzy.com/kjqy/70069.html