

#%% import scipy.io as sio import numpy as np import matplotlib.pyplot as plt import pandas as pd pd.set_option('precision', 2) def plot_curves(method, source, target, num_sam=10240, num_batch=256, num_epoch=200, top_epoch=20, ymin = -0.1, ymax=1.1, ax1=None): file = 'Exp1_balance_ok/CWRU_RMS_{}_{}_{}_1.00_5.mat'.format(source, target, method) data = sio.loadmat(file) # print(data.keys()) map_dict = {
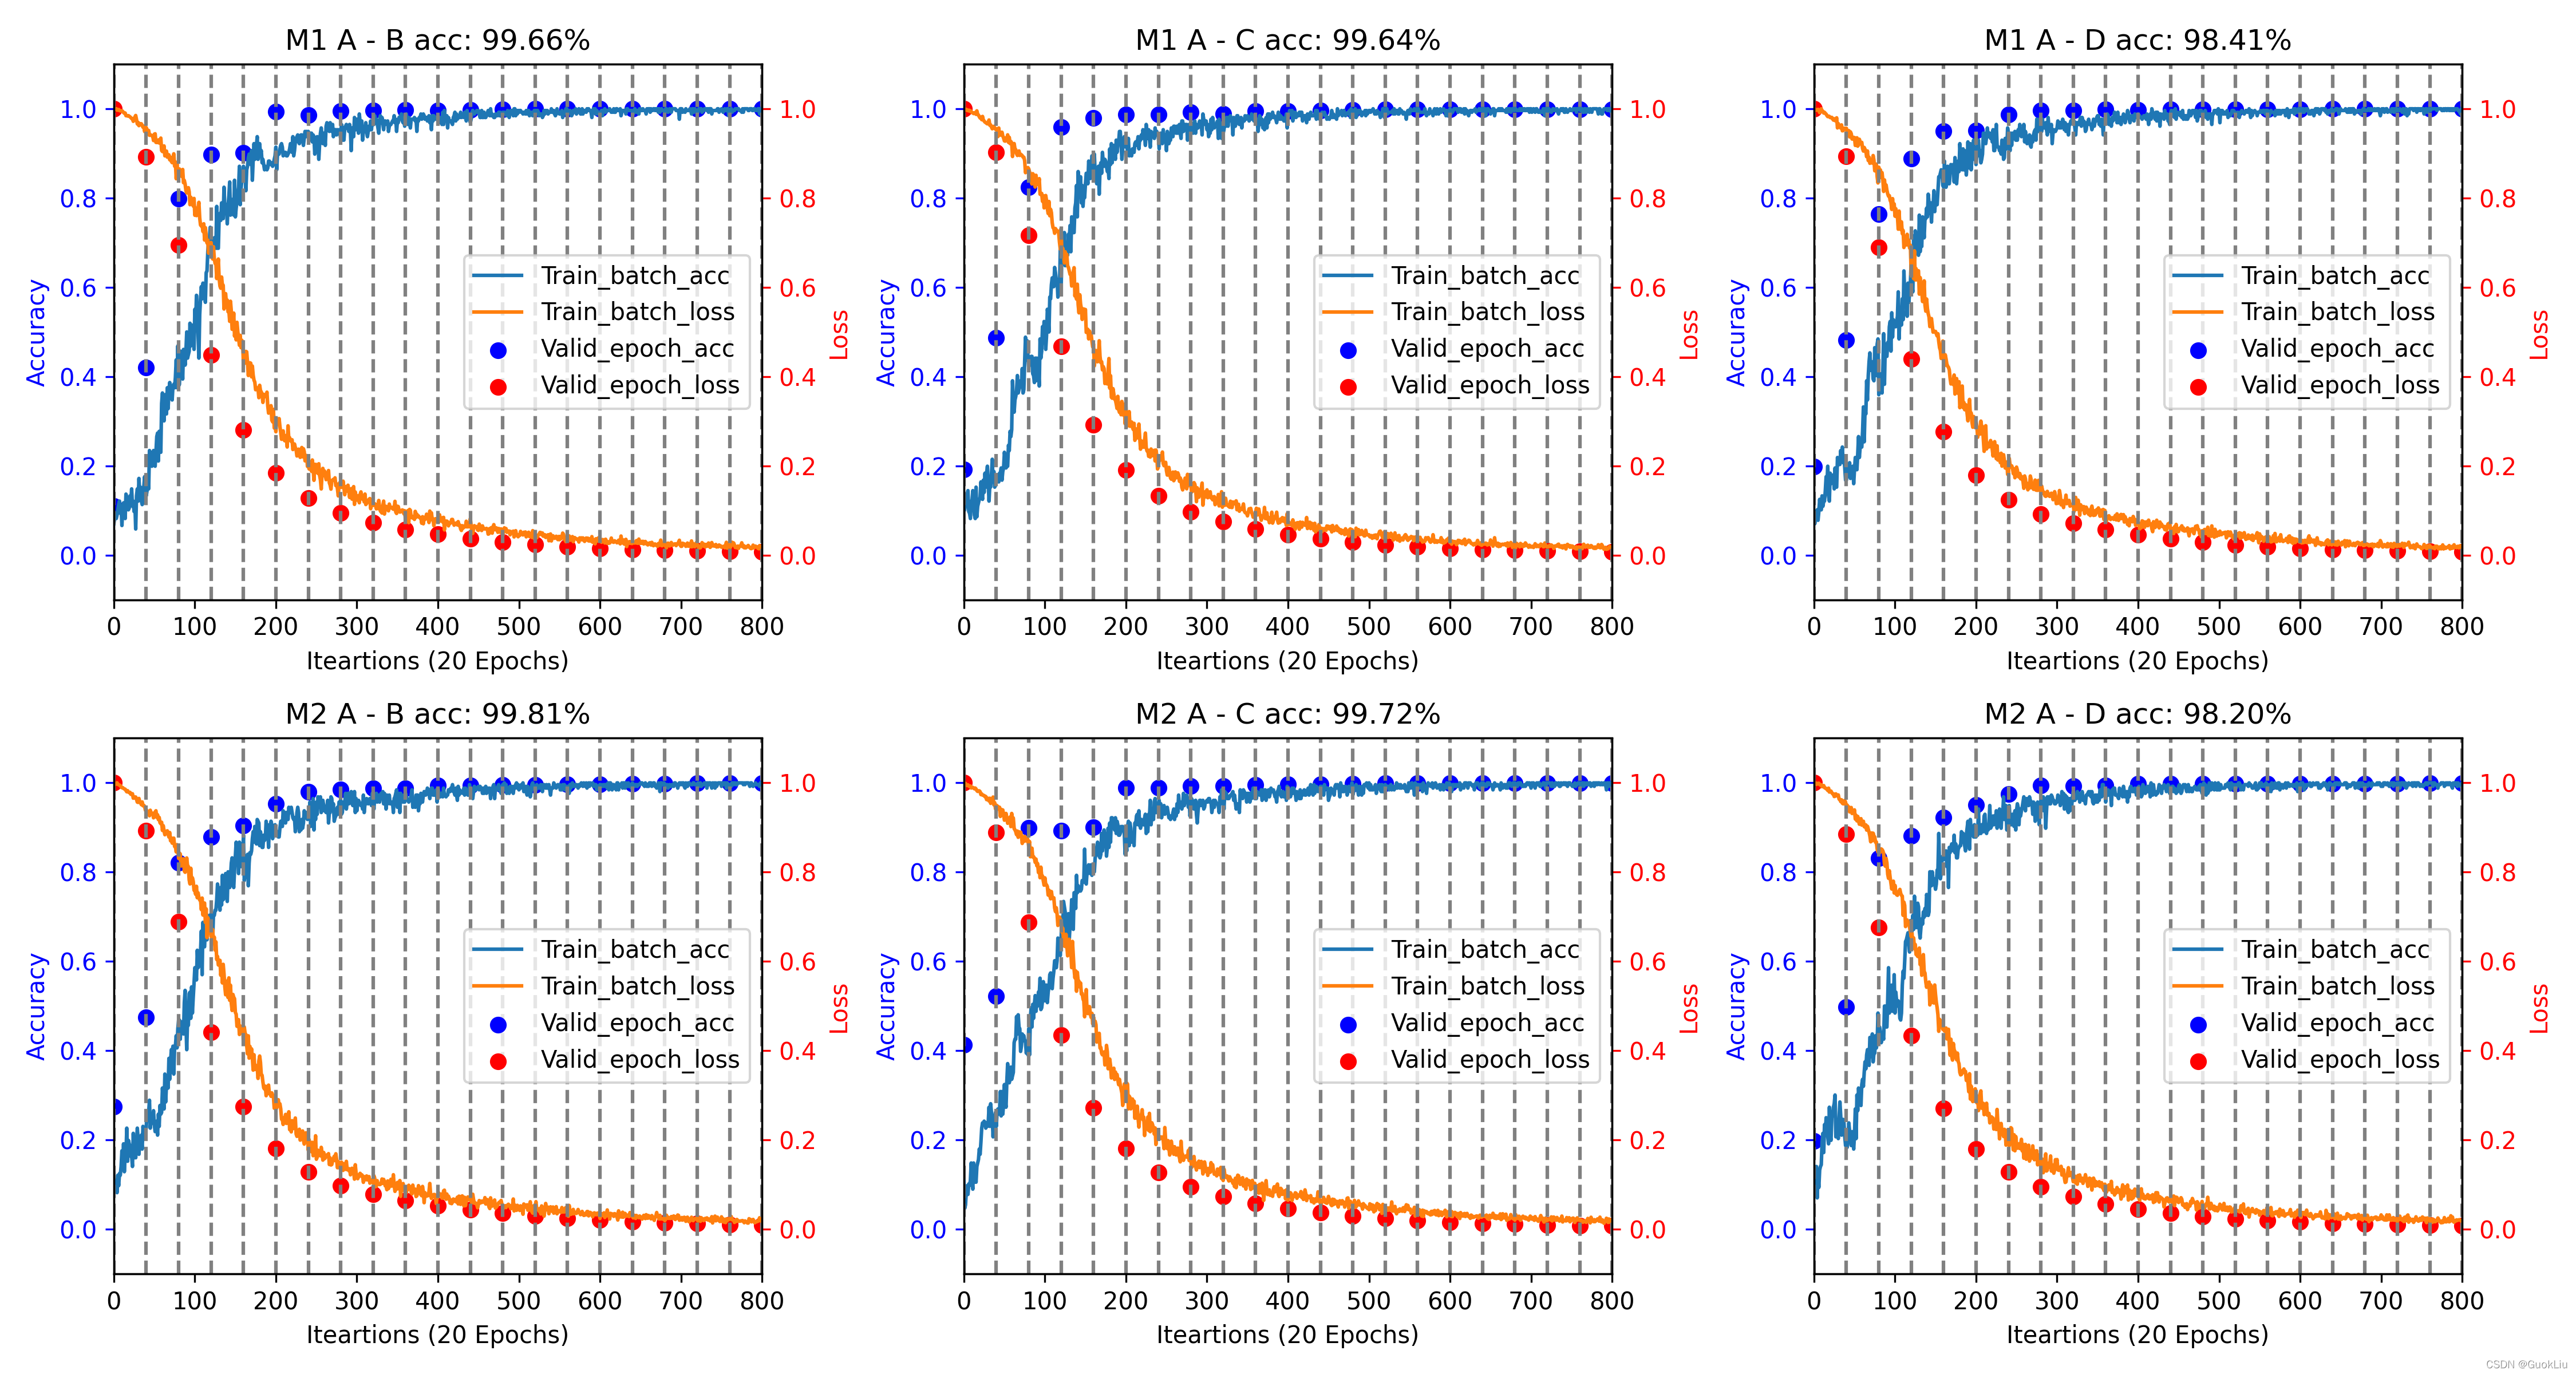
0:'A', 1:'B', 2:'C', 3:'D'} bat_acc = data['bat_acc'].ravel() bat_los = data['bat_los'].ravel() val_acc = data['val_acc'].ravel() val_los = data['val_los'].ravel() pre_acc = data['pre_acc'].ravel() fin_acc = data['Acc'][0,0] num_iter = int(num_sam/num_batch*num_epoch) if ax1==None: fig = plt.figure() fig.patch.set_facecolor('white') ax1 = fig.add_subplot(111) ax2 = ax1.twinx() x_epoch = np.linspace(0,num_iter,num_epoch,endpoint=False) ax1.plot(bat_acc, label='Train_bacth_acc') ax1.plot(bat_los/np.max(bat_los), label='Train_batch_loss') ax1.scatter(x_epoch, val_acc, c='b', label='Val_Train_epoch_acc') ax1.scatter(x_epoch, val_los/np.max(val_los), c='r', label='Valid_epoch_loss') ax1.vlines(x_epoch,ymin,ymax,linestyles='dashed', color='grey') ax1.set_xlim(0,int(num_sam/num_batch)*top_epoch) ax1.set_ylim(ymin,ymax) ax1.vlines(x_epoch,ymin,ymax,linestyles='dashed', color='grey') ax1.set_title('{} {} - {} acc: {:.2f}%'.format(method, map_dict[source], map_dict[target], fin_acc)) ax1.set_ylabel('Accuracy') ax2.set_ylabel('Loss') # Set title ax1.set_xlabel('Iteartions ({} Epochs)'.format(top_epoch)) # Set axis color ax1.yaxis.label.set_color('blue') ax2.yaxis.label.set_color('red') ax1.tick_params(axis='y', colors='blue') ax2.tick_params(axis='y', colors='red') ax1.legend(loc='center right') else: ax1.plot(bat_acc, label='Train_batch_acc') ax1.plot(bat_los/np.max(bat_los), label='Train_batch_loss') x_epoch = np.linspace(0,num_iter,num_epoch,endpoint=False) ax1.scatter(x_epoch, val_acc, c='b',label='Valid_epoch_acc') ax1.scatter(x_epoch, val_los/np.max(val_los), c='r', label='Valid_epoch_loss') ax1.vlines(x_epoch,ymin,ymax,linestyles='dashed', color='grey') ax1.set_title('{} {} - {} acc: {:.2f}%'.format(method, map_dict[source], map_dict[target], fin_acc)) # Set Y labels ax1.set_ylabel('Accuracy') ax2 = ax1.twinx() ax2.set_ylabel('Loss') # Set limitations ax1.set_xlim(0,int(num_sam/num_batch)*top_epoch) ax1.set_ylim(ymin,ymax) ax2.set_ylim(ymin,ymax) # Set title ax1.set_xlabel('Iteartions ({} Epochs)'.format(top_epoch)) # Set axis color ax1.yaxis.label.set_color('blue') ax2.yaxis.label.set_color('red') ax1.tick_params(axis='y', colors='blue') ax2.tick_params(axis='y', colors='red') ax1.legend(loc='center right') if __name__=='__main__': mode='multi' # Plot single-method on single-task if mode=='single': methods = ['ACAA_cat'] tasks = [(3,0)] for rdx, method in enumerate(methods): for cdx, (source, target) in enumerate(tasks): plot_curves(method, source, target, ymin = -0.1, ymax=1.1, ax1=None) plt.tight_layout() # Plot multi-methods crossing multi-tasks if mode=='multi': methods = ['M1','M2'] tasks = [(s,t) for s in range(4) for t in range(4) if s!=t] tasks = [(s,t) for s in range(1) for t in range(4) if s!=t] num_row = len(methods) num_col = len(tasks) fig, ax=plt.subplots(num_row, num_col, figsize=(5*num_col, 4*num_row)) fig.patch.set_facecolor('white') for rdx, method in enumerate(methods): for cdx, (source, target) in enumerate(tasks): plot_curves(method, source, target, ymin = -0.1, ymax=1.1, ax1=ax[rdx, cdx]) plt.tight_layout() plt.savefig('Training_visualization.png', dpi=300) if mode=='dataframe': methods = ['M1t','M2'] tasks = [(s,t) for s in range(4) for t in range(4) if s!=t] num_row = len(methods) num_col = len(tasks) map_dict = {
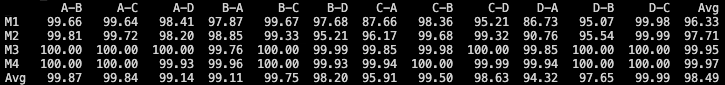
0:'A', 1:'B', 2:'C', 3:'D'} col_name = ['{}-{}'.format(map_dict[s], map_dict[t]) for (s,t) in tasks] result_arr = pd.DataFrame(np.zeros((num_row, num_col)), index=methods, columns=col_name) print(result_arr) for rdx, method in enumerate(methods): for cdx, (source, target) in enumerate(tasks): file = 'Exp1_balance_ok/CWRU_RMS_{}_{}_{}_1.00_5.mat'.format(source, target, method) data = sio.loadmat(file) fin_acc = data['Acc'][0,0] s=map_dict[source] t=map_dict[target] result_arr.loc[method, s+'-'+t] = fin_acc result_arr['Avg'] = result_arr.mean(axis=1) result_arr.loc['Avg'] = result_arr.mean(axis=0) print(result_arr) 讯享网
版权声明:本文内容由互联网用户自发贡献,该文观点仅代表作者本人。本站仅提供信息存储空间服务,不拥有所有权,不承担相关法律责任。如发现本站有涉嫌侵权/违法违规的内容,请联系我们,一经查实,本站将立刻删除。
如需转载请保留出处:https://51itzy.com/kjqy/64899.html