
<p>#主成分分析</p> 讯享网
import pandas as pd
import numpy as np
from sklearn.datasets import load_iris
import matplotlib.pyplot as plt
from sklearn.preprocessing import StandardScaler
%matplotlib inline
#载入数据
iris = load_iris()
df = pd.DataFrame(iris.data,columns=iris.feature_names)
df[‘label’] = iris.target
df.columns = [‘sepal length’,‘sepal width’,‘petal length’,‘petal width’,‘label’]
print(df.label.value_counts())
print(df.tail())
#查看数据
X = df.iloc[:,0:4]
y = df.iloc[:,4]
print(“查看第一个数据: ”,X.iloc[0,0:4])
print (“查看第一个标签: ”,y.iloc[0])
class PCA():
def init(self,n_components):
pass
‘’‘相当于self.n_components = ncomponents
self.mean = None
self.components_ = None
self.explainedvariance = None’‘’
def fit(self,X):
n_sample = np.shape(X)[0] #获取样本数量,获取数据矩阵 X 的行数
‘’‘covariance_matrix = (1/(n_sample-1)*(X - X.mean(axis=0).T.dot(X-X.mean(axis=0))))#计算协方差矩阵。X - X.mean(axis=0)计算特征的平均值
eigenvalues,eigenvectors = np.linalg.eig(covariance_matrix) #对协方差矩阵进行特征值分解’‘’
# 标准化数据
X_centered = X - X.mean(axis=0)
# 计算协方差矩阵
covariance_matrix = (1 / (n_sample - 1)) * (X_centered.T.dot(X_centered))
#对特征值(特征向量)从大到小排序
idx = eigenvalues.argsort()[::-1]
#从排序后的特征值中选择前 n_components 个最大特征值。
eigenvalues = eigenvalues[idx][:n_components]
eigenvectors = np.atleast_1d(eigenvectors[:,idx])[:, :n_components]
#得到低维表示
X_transfoemed = X.dot(eigenvectors)
return X_transfoemed
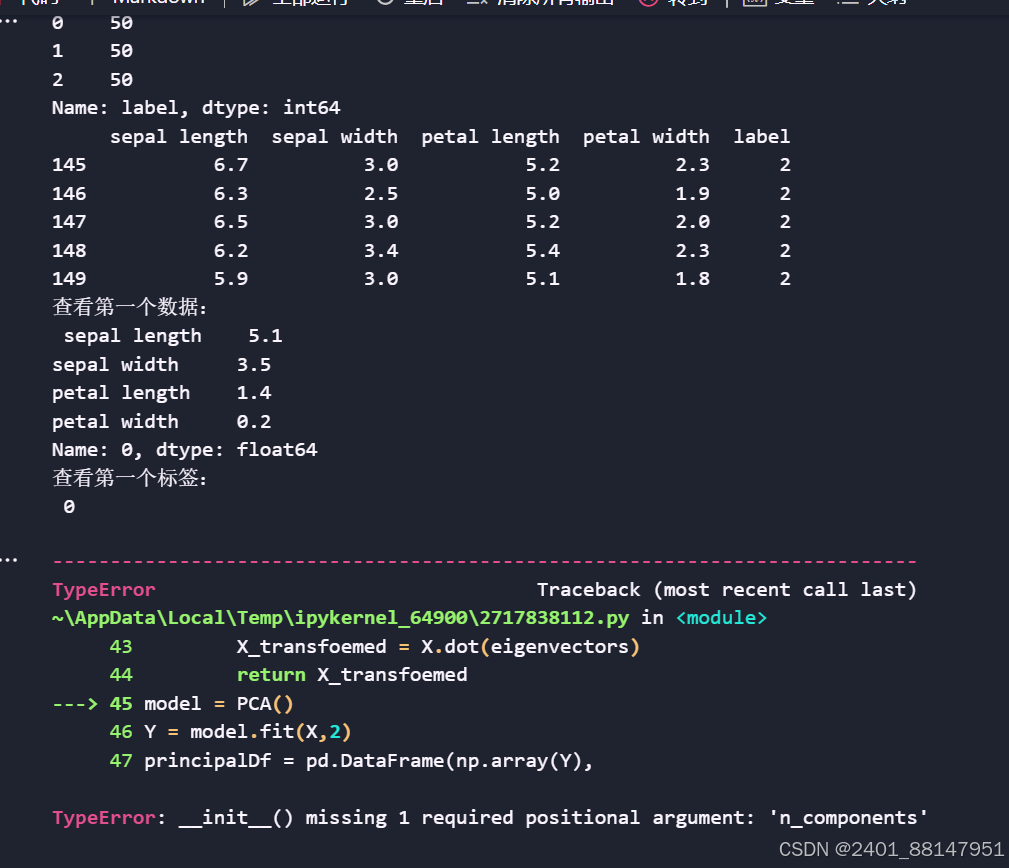
model = PCA()

Y = model.fit(X,2)
principalDf = pd.DataFrame(np.array(Y),
columns=[‘principal component 1’,‘principal component 2’])
Df = pd.concat([principalDf,y],axis = 1)
fig = plt.figure(figsize = (5,5))
ax = fig.add_subplot(1,1,1)
ax.set_xlabel(‘Principal Component 1’,fontsize = 15)
ax.set_ylabel(‘Principal Component 2’,fontsize = 15)
ax.set_title(‘2 component PCA’,fontsize = 20)
targets = [0,1,2]
colors = [‘r’,‘g’,‘b’]
for target,color in zip(targets,colors):
indicesToKeep = Df[‘label’] == target
ax.scatter(Df.loc[indicesToKeep,‘principal component 1’]
,[indicesToKeep,‘principal component 2’]
,c = color
,s = 50)
ax.legend(targets)
ax.grid()
plt.show()
程序一直报这个错误,参考过AI编写也是有使用n_components
尝试过在一开始导入k_componts,后面的也使用这个,但依旧不能运行
版权声明:本文内容由互联网用户自发贡献,该文观点仅代表作者本人。本站仅提供信息存储空间服务,不拥有所有权,不承担相关法律责任。如发现本站有涉嫌侵权/违法违规的内容,请联系我们,一经查实,本站将立刻删除。
如需转载请保留出处:https://51itzy.com/kjqy/184712.html