
客户细分
1.项目概述(1. Project Overview)
1.1简介(1.1 Introduction)
This is a capstone project for the Udacity data science nanodegree program.
这是Udacity数据科学纳米学位计划的基本项目。
In this project, I analyze demographics data for customers of a mail-order sales company in Germany, comparing it against demographics information for the general population. I use unsupervised learning techniques to perform customer segmentation, identifying the parts of the population that best describe the core customer base of the company. Then, I use a supervised model to predict which individuals are most likely to convert into becoming customers for the company.
在这个项目中,我分析了德国一家邮购销售公司的客户的人口统计数据,并将其与一般人群的人口统计信息进行了比较。 我使用无监督学习技术执行客户细分,确定最能描述公司核心客户群的人群。 然后,我使用监督模型来预测哪些人最有可能转化为公司的客户。
1.2数据集 (1.2 Data sets)
The data is provided by Bertelsmann Arvato Analytics and represents a real-life data science task. There are four data files associated with this project:
数据由贝塔斯曼Arvato Analytics提供,代表了现实生活中的数据科学任务。 有四个与该项目关联的数据文件:
Udacity_AZDIAS_052018.csv: Demographics data for the general population of Germany; 891 211 persons (rows) x 366 features (columns).Udacity_AZDIAS_052018.csv:德国总人口的人口统计数据; 人(行)x 366个特征(列)。Udacity_CUSTOMERS_052018.csv: Demographics data for customers of a mail-order company; 191 652 persons (rows) x 369 features (columns).Udacity_CUSTOMERS_052018.csv:邮购公司客户的人口统计数据; 人(行)x 369个特征(列)。Udacity_MAILOUT_052018_TRAIN.csv: Demographics data for individuals who were targets of a marketing campaign; 42 982 persons (rows) x 367 (columns).Udacity_MAILOUT_052018_TRAIN.csv:作为营销活动目标的个人的人口统计数据; 42982人(行)x 367(列)。Udacity_MAILOUT_052018_TEST.csv: Demographics data for individuals who were targets of a marketing campaign; 42 833 persons (rows) x 366 (columns).Udacity_MAILOUT_052018_TEST.csv:作为营销活动目标的个人的人口统计数据; 42833人(行)x 366(列)。
There are also two Excel spreadsheets, providing more information about the columns depicted in the data files.
还有两个Excel电子表格,它们提供有关数据文件中描述的列的更多信息。
- DIAS Information Levels — Attributes 2017.xlsx is a top-level list of attributes and descriptions, organized by the informational category. DIAS信息级别-属性2017.xlsx是按信息类别组织的属性和说明的顶级列表。
- DIAS Attributes — Values 2017.xlsx is a detailed mapping of data values for each feature in alphabetical order. DIAS属性-值2017.xlsx是按字母顺序排列的每个要素的数据值的详细映射。
1.3问题与方法 (1.3 Problem and Approach)
There are four parts in this project:
该项目分为四个部分:

- Get to know the data 了解数据
In this part, I will explore the data and then process the data regarding the missing values, data type transformation, data imputation, and feature scaling. The cleaned data will be used in the following study.
在这一部分中,我将探索数据,然后处理有关缺失值,数据类型转换,数据插补和特征缩放的数据。 清除的数据将在以下研究中使用。
2. Customer segmentation report
2.客户细分报告
In this part, I will compare the demographics data for customers against the information for the general population, to identify the core customer base of the company. I will use unsupervised learning techniques (k-means) to perform customer segmentation. Principal component analysis (PCA) will be used to reduce dimensions.
在这一部分中,我将比较客户的人口统计数据与一般人群的信息,以识别公司的核心客户群。 我将使用无监督学习技术(k-means)进行客户细分。 主成分分析(PCA)将用于减小尺寸。
3. Supervised learning model
3.监督学习模型
Here, I will use supervised learning methods to predict which individuals are most likely to convert into becoming customers for the company. I will compare four different models and optimize the model through GridSearchCV.
在这里,我将使用监督学习方法来预测哪些人最有可能转化为公司的客户。 我将比较四种不同的模型,并通过GridSearchCV优化模型。
4. Kaggle competition
4. Kaggle比赛
The result will be submitted for Kaggle competition.
结果将提交给Kaggle比赛。
1.4指标 (1.4 Metrics)
I will use the area under the receiver operating characteristic curve (ROC_AUC) for model selection. The ROC curve shows the false positive rate (FPR) against the true positive rate (TPR) at all possible thresholds. The idea curve is close to the top left. The area under the ROC curve (AUC) provides a way to evaluate the ROC curve to select the optimal models. The reason I use ROC_AUC is because this is a classification problem with imbalanced classes, and ROC_AUC is often much more meaningful than accuracy for this kind of problems.
我将使用接收器工作特性曲线(ROC_AUC)下的区域进行模型选择。 ROC曲线显示在所有可能的阈值下的假阳性率(FPR)与真阳性率(TPR)。 想法曲线靠近左上方。 ROC曲线下的面积(AUC)提供了一种评估ROC曲线以选择**模型的方法。 我使用ROC_AUC的原因是,这是类不平衡的分类问题,对于此类问题,ROC_AUC通常比准确性更有意义。
2.分析,方法论和结果 (2. Analysis, Methodology and Results)
2.1数据处理(2.1 Data processing)
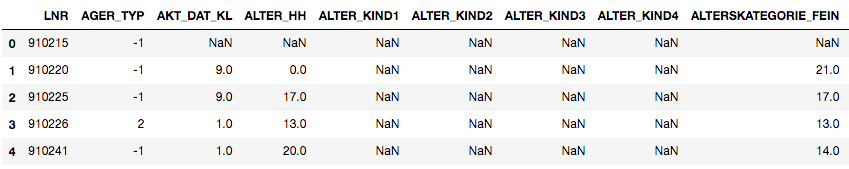
I first explored four data files associated with this project:
我首先浏览了与该项目关联的四个数据文件:
Udacity_AZDIAS_052018.csv: Demographics data for the general population of Germany; 891 211 persons (rows) x 366 features (columns).Udacity_AZDIAS_052018.csv:德国总人口的人口统计数据; 人(行)x 366个特征(列)。
版权声明:本文内容由互联网用户自发贡献,该文观点仅代表作者本人。本站仅提供信息存储空间服务,不拥有所有权,不承担相关法律责任。如发现本站有涉嫌侵权/违法违规的内容,请联系我们,一经查实,本站将立刻删除。
如需转载请保留出处:https://51itzy.com/kjqy/18187.html