
import pandas as pd import numpy as np digits_train = pd.read_csv('../Datasets/Breast-Cancer/optdigits.tra', header=None) digits_test = pd.read_csv('../Datasets/Breast-Cancer/optdigits.tes', header=None) x_digits = digits_train[np.arange(64)] y_digits = digits_train[64] X_train = x_digits.dropna(how='any') y_train = y_digits.dropna(how='any') x_digits_test = digits_test[np.arange(64)] y_digits_test = digits_test[64] X_test = x_digits_test.dropna(how='any') y_test = y_digits_test.dropna(how='any') print(X_train) print(y_train) from sklearn.svm import LinearSVC svc = LinearSVC() svc.fit(X_train,y_train) y_predict = svc.predict(X_test) from sklearn.decomposition import PCA estimator = PCA(n_components=20) pca_X_train = estimator.fit_transform(X_train) pca_X_test = estimator.transform(X_test) pca_svc = LinearSVC() pca_svc.fit(pca_X_train,y_train) pca_y_predict = pca_svc.predict(pca_X_test) target_namearray = [] from sklearn.metrics import classification_report print('The accuracy of linesvm is',svc.score(X_test,y_test)) print(classification_report(y_test,y_predict,target_names = np.arange(10).astype(str))) from matplotlib import pyplot as plt def show_values(pc, fmt="%.2f", kw): ''' Heatmap with text in each cell with matplotlib's pyplot Source: https://stackoverflow.com/a// By HYRY ''' global zip import itertools zip = getattr(itertools, 'izip', zip) pc.update_scalarmappable() ax = pc.axes for p, color, value in zip(pc.get_paths(), pc.get_facecolors(), pc.get_array()): x, y = p.vertices[:-2, :].mean(0) if np.all(color[:3] > 0.5): color = (0.0, 0.0, 0.0) else: color = (1.0, 1.0, 1.0) ax.text(x, y, fmt % value, ha="center", va="center", color=color, kw) def cm2inch(*tupl): ''' Specify figure size in centimeter in matplotlib Source: https://stackoverflow.com/a// By gns-ank ''' inch = 2.54 if type(tupl[0]) == tuple: return tuple(i/inch for i in tupl[0]) else: return tuple(i/inch for i in tupl) def heatmap(AUC, title, xlabel, ylabel, xticklabels, yticklabels, figure_width=40, figure_height=20, correct_orientation=False, cmap='RdBu'): ''' Inspired by: - https://stackoverflow.com/a// - https://stackoverflow.com/a// ''' # Plot it out fig, ax = plt.subplots() #c = ax.pcolor(AUC, edgecolors='k', linestyle= 'dashed', linewidths=0.2, cmap='RdBu', vmin=0.0, vmax=1.0) c = ax.pcolor(AUC, edgecolors='k', linestyle= 'dashed', linewidths=0.2, cmap=cmap) # put the major ticks at the middle of each cell ax.set_yticks(np.arange(AUC.shape[0]) + 0.5, minor=False) ax.set_xticks(np.arange(AUC.shape[1]) + 0.5, minor=False) # set tick labels #ax.set_xticklabels(np.arange(1,AUC.shape[1]+1), minor=False) ax.set_xticklabels(xticklabels, minor=False) ax.set_yticklabels(yticklabels, minor=False) # set title and x/y labels plt.title(title) plt.xlabel(xlabel) plt.ylabel(ylabel) # Remove last blank column plt.xlim( (0, AUC.shape[1]) ) # Turn off all the ticks ax = plt.gca() for t in ax.xaxis.get_major_ticks(): t.tick1On = False t.tick2On = False for t in ax.yaxis.get_major_ticks(): t.tick1On = False t.tick2On = False # Add color bar plt.colorbar(c) # Add text in each cell show_values(c) # Proper orientation (origin at the top left instead of bottom left) if correct_orientation: ax.invert_yaxis() ax.xaxis.tick_top() # resize fig = plt.gcf() #fig.set_size_inches(cm2inch(40, 20)) #fig.set_size_inches(cm2inch(40*4, 20*4)) fig.set_size_inches(cm2inch(figure_width, figure_height)) def plot_classification_report(classification_report, title='Classification report ', cmap='RdBu'): ''' Plot scikit-learn classification report. Extension based on https://stackoverflow.com/a// ''' lines = classification_report.split('\n') classes = [] plotMat = [] support = [] class_names = [] for line in lines[2 : (len(lines) - 2)]: t = line.strip().split() if len(t) < 2: continue classes.append(t[0]) v = [float(x) for x in t[1: len(t) - 1]] support.append(int(t[-1])) class_names.append(t[0]) print(v) plotMat.append(v) print('plotMat: {0}'.format(plotMat)) print('support: {0}'.format(support)) xlabel = 'Metrics' ylabel = 'Classes' xticklabels = ['Precision', 'Recall', 'F1-score'] yticklabels = ['{0} ({1})'.format(class_names[idx], sup) for idx, sup in enumerate(support)] figure_width = 25 figure_height = len(class_names) + 7 correct_orientation = False heatmap(np.array(plotMat), title, xlabel, ylabel, xticklabels, yticklabels, figure_width, figure_height, correct_orientation, cmap=cmap) #传入相应的report结果 def main(): sampleClassificationReport =classification_report(y_test,y_predict,target_names = np.arange(10).astype(str)) plot_classification_report(sampleClassificationReport) plt.savefig('test_plot_classif_report.png', dpi=200, format='png', bbox_inches='tight') plt.close() sampleClassificationReport1 =classification_report(y_test,pca_y_predict,target_names = np.arange(10).astype(str)) plot_classification_report(sampleClassificationReport1) plt.savefig('test_plot_classif_report1.png', dpi=200, format='png', bbox_inches='tight') plt.close() if __name__ == "__main__": main() #cProfile.run('main()') # if you want to do some profiling print('The accuracy of svm linesvm is',pca_svc.score(pca_X_test,y_test)) print(classification_report(y_test,pca_y_predict,target_names = np.arange(10).astype(str)))讯享网
压缩后性能略微有下降,但使用pca后降低了68.75%的维度

讯享网The accuracy of linesvm is 0.34001 precision recall f1-score support 0 0.99 0.98 0.99 178 1 0.86 0.90 0.88 182 2 0.96 0.98 0.97 177 3 0.99 0.90 0.94 183 4 0.94 0.97 0.95 181 5 0.91 0.96 0.94 182 6 0.99 0.98 0.98 181 7 0.98 0.92 0.95 179 8 0.75 0.90 0.82 174 9 0.93 0.77 0.84 180 avg / total 0.93 0.93 0.93 1797
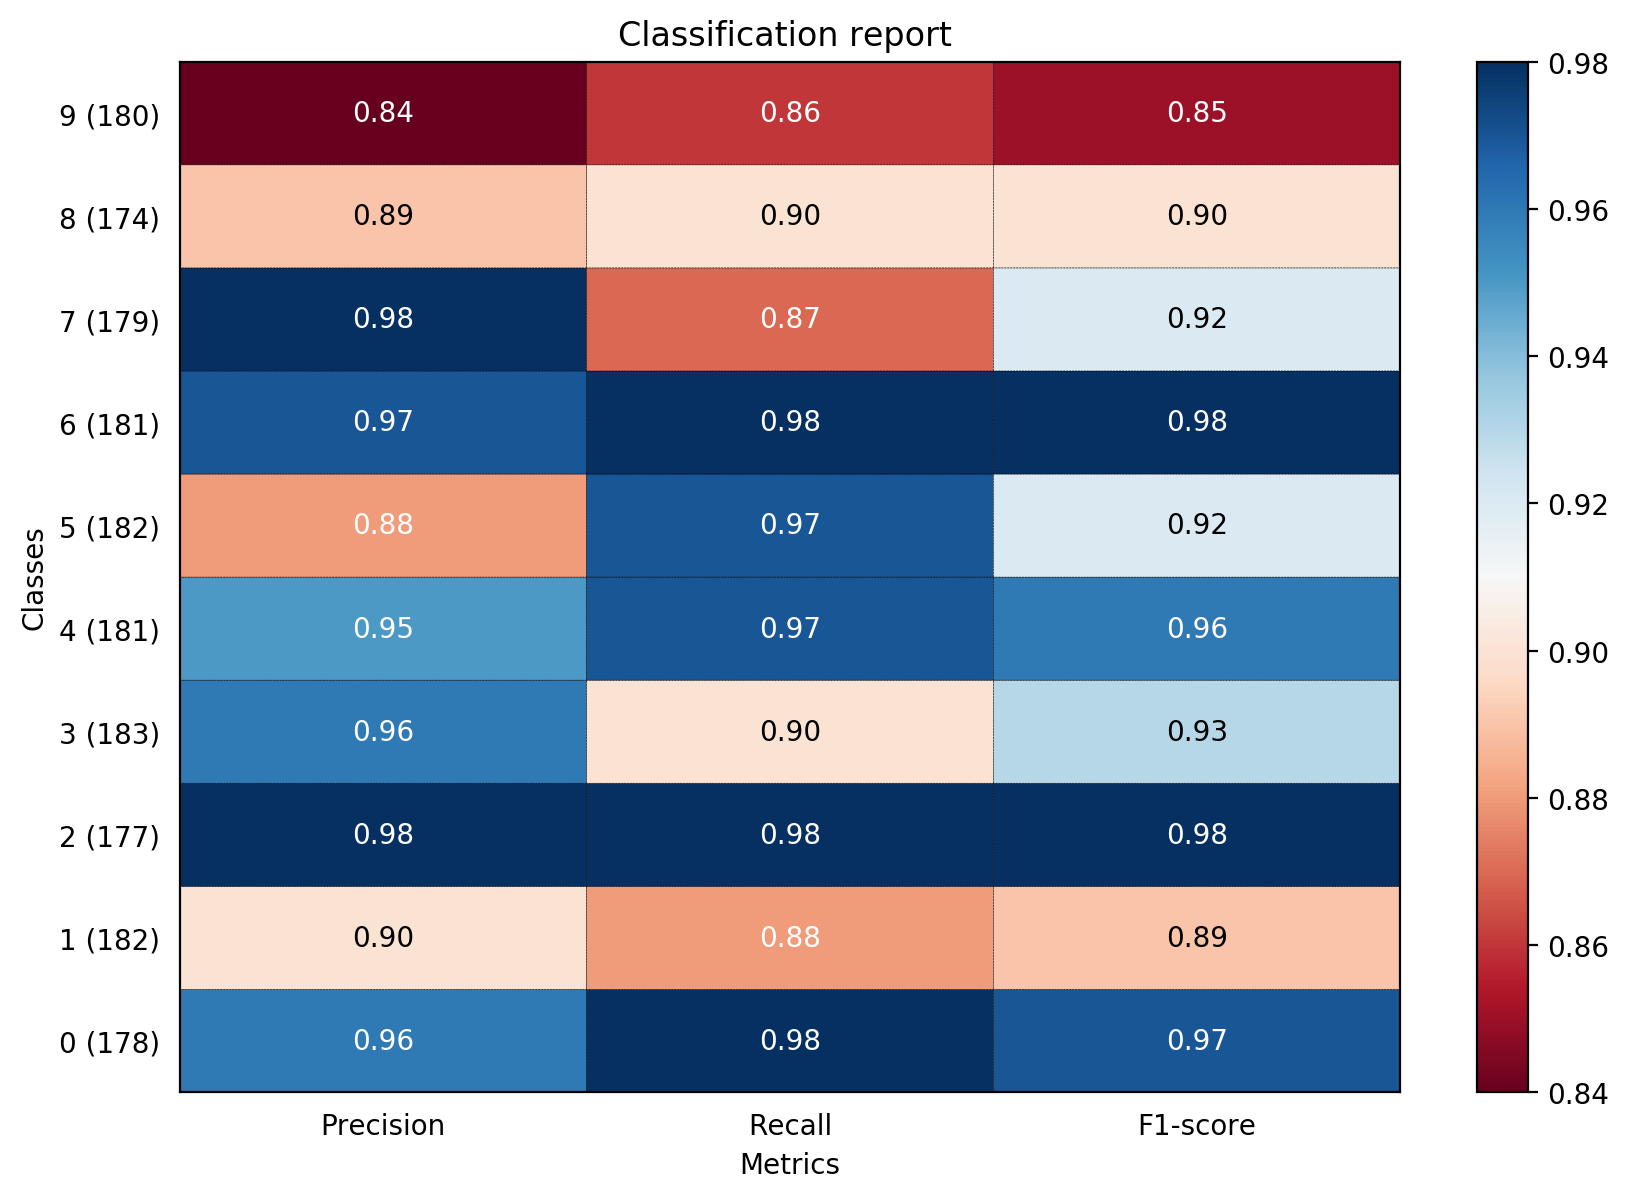
The accuracy of svm linesvm is 0.15415 precision recall f1-score support 0 0.96 0.98 0.97 178 1 0.90 0.88 0.89 182 2 0.98 0.98 0.98 177 3 0.96 0.90 0.93 183 4 0.95 0.97 0.96 181 5 0.88 0.97 0.92 182 6 0.97 0.98 0.98 181 7 0.98 0.87 0.92 179 8 0.89 0.90 0.90 174 9 0.84 0.86 0.85 180 avg / total 0.93 0.93 0.93 1797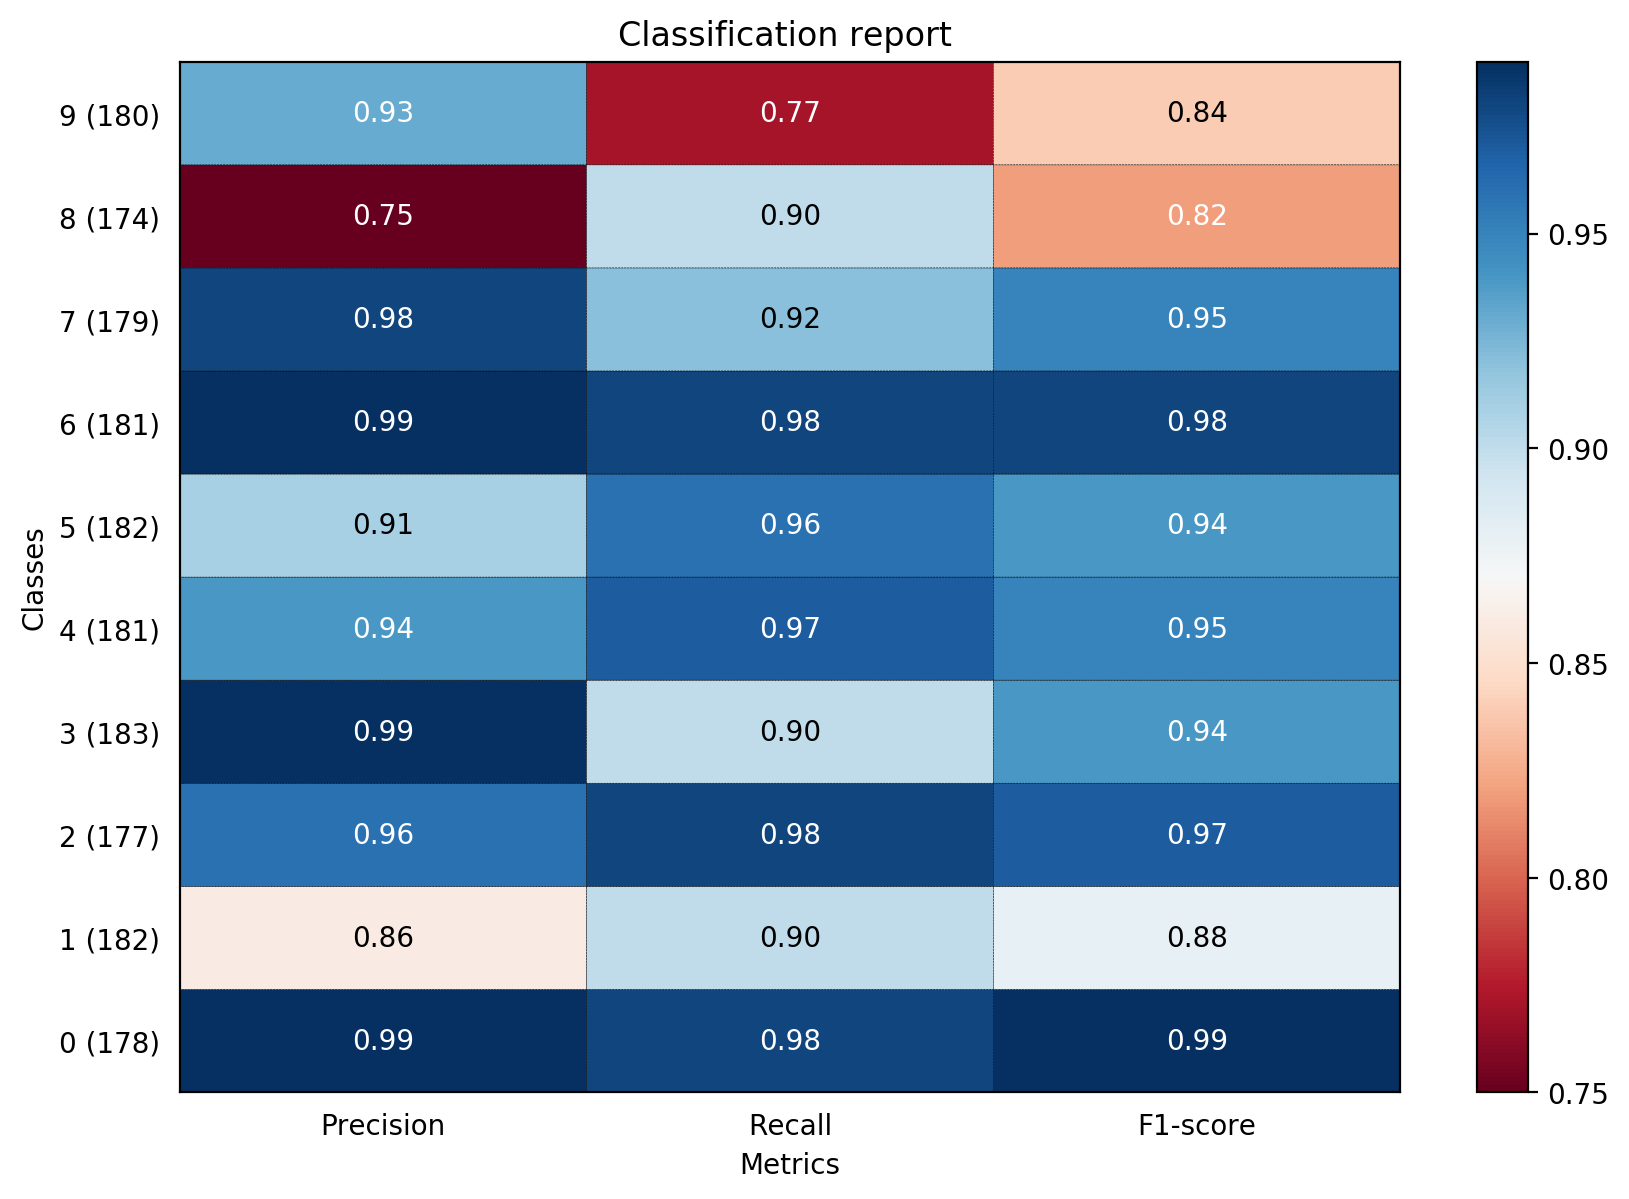
版权声明:本文内容由互联网用户自发贡献,该文观点仅代表作者本人。本站仅提供信息存储空间服务,不拥有所有权,不承担相关法律责任。如发现本站有涉嫌侵权/违法违规的内容,请联系我们,一经查实,本站将立刻删除。
如需转载请保留出处:https://51itzy.com/kjqy/132517.html