
sklearn的数据集库datasets提供很多不同的数据集,主要包含以下几大类:
1. 通用数据集
2. 真实世界中的数据集
3. 样本生成器
4. 样本图片
5. svmlight或libsvm格式的数据
6. 从http://openml.org下载的数据
7. 从外部加载的数据
用的比较多的就是1和3,这里进行主要介绍,其他的会进行简单介绍,但是不建议使用。
1 简介
1.1 加载数据集
- 加载获取流行数据集
datasets.load_*() 讯享网
- 获取小规模数据集,数据包含在datasets里
讯享网datasets.fetch_*(data_home=None)
获取大规模数据集,需要从网络上下载,函数的第一个参数是data_home,表示数据集下载的目录,默认是 ~/scikit_learn_data/
1.2 获取数据集返回的类型
load和fetch返回的数据类型datasets.base.Bunch(字典格式)
- data:特征数据数组,是 [n_samples * n_features] 的二维 numpy.ndarray 数组
- target:标签数组,是 n_samples 的一维 numpy.ndarray 数组
- DESCR:数据描述
- feature_names:特征名,新闻数据,手写数字、回归数据集没有
- target_names:标签名,回归数据集没有
例子:
from sklearn.datasets import load_iris iris_dataset = load_iris() print("获取特征值") print(iris_dataset.data[:5]) print("获取目标值") print(iris_dataset.target[:5]) print('iris数据集的描述') print(iris_dataset.DESCR) 1.3 数据集进行分割
机器学习一般的数据集会划分为两个部分:
- 训练数据:用于训练,构建模型
- 测试数据:在模型检验时使用,用于评估模型是否有效
划分比例:
- 训练集:70% 80% 75%
- 测试集:30% 20% 30%
讯享网sklearn.model_selection.train_test_split(arrays, *options)
- x:数据集的特征值
- y:数据集的标签值
- test_size:测试集的大小,一般为float
- shuffle:分割之前是否对数据进行洗牌(默认True)
- random_state:随机数种子,不同的种子会造成不同的随机采样结果。相同的种子采样结果相同。当种子固定时,可以实现实验复现,方便调节参数
- return:训练集特征值,测试集特征值,训练标签,测试标签(默认随机取)
注:只有当shuffle=True时,random_state才起作用。
from sklearn.model_selection import train_test_split # 注意返回值 训练集 测试集顺序不能乱 x_train, x_test, y_train, y_test = train_test_split(iris_dataset.data, iris_dataset.target, test_size=0.25) print('训练集特征值和目标值:',x_train,y_train) print('测试集特征值和目标值:',x_test,y_test) 1.4 查看数据集分布
seaborn.lmplot()是一个非常有用的方法,它会在绘制二维散点图时,自动完成回归拟合
- sns.lmplot() 里的 x, y 分别代表横纵坐标的列名,
- data= 是关联到数据集,
- hue=*代表按照 species即花的类别分类显示,
- fit_reg=是否进行线性拟合。默认进行线性拟合
讯享网%matplotlib inline # 内嵌绘图 import seaborn as sns import matplotlib.pyplot as plt import pandas as pd # 支持中文 plt.rcParams['font.sans-serif'] = ['SimHei'] plt.rcParams['axes.unicode_minus'] = False iris_d = pd.DataFrame(iris_dataset['data'], columns=['Sepal_Length', 'Sepal_width', 'Petal_Length', 'Petal_Width']) # 列名 iris_d['Species'] = iris_dataset.target def plot_iris(iris, col1, col2): sns.lmplot(x = col1, y = col2, data = iris, hue = "Species", fit_reg = False) plt.xlabel(col1) plt.ylabel(col2) plt.title("鸢尾花种类分布图") plt.show() plot_iris(iris_d, 'Petal_Width', 'Sepal_Length')

讯享网
2 通用数据集

2.1 波士顿房价
波士顿房价数据集包含506组数据,每条数据包含房屋以及房屋周围的详细信息。其中包含城镇犯罪率、一氧化氮浓度、住宅平均房间数、到中心区域的加权距离以及自住房平均房价等。因此,波士顿房价数据集能够应用到回归问题上。

这里是波士顿房价数据集的部分房价数据信息展示:例如:NOX这个属性代表一氧化氮的浓度,RM这个属性代表的是住宅的平均房间数;
可以通过使用sklearn.datasets.load_boston即可加载相关的数据集;
- 重要参数:return_X_y:表示是否返回target(即价格),默认为False, 只返回data(即属性)。
示例:
from sklearn.datasets import load_boston boston = load_boston() print(boston.data.shape) # (506, 13) print(boston.target.shape) # (506,) 当return_X_y设置为True的时候:load_boston同时返回data和target
讯享网data, target = load_boston(return_X_y=True) print(data.shape) # (506, 13) print(target.shape) # (506,)
2.2 鸢尾花
鸢尾花数据集是数据挖掘任务常用的一个数据集;鸢尾花数据集采集的是鸢尾花的测量数据以及其所属的类别。
测量数据包括:萼片长度、萼片宽度、花瓣长度、花瓣宽度。
类别共分为三类:Iris Setosa,Iris Versicolour,Iris Virginica。该数据集可用于多分类问题。

使用sklearn.datasets.load_iris即可加载相关数据集
- 参数:return_X_y:若为True,则以(data,target)形式返回数据,默认为False,表示以字典形式返回数据全部信息(包含data和target)
示例:
from sklearn.datasets import load_iris iris = load_iris() print(iris.data.shape, iris.target.shape) # (150, 4) (150,) print(iris.feature_names) # ['sepal length (cm)', 'sepal width (cm)', 'petal length (cm)', 'petal width (cm)'] 2.3 糖尿病
主要包括442个实例,每个实例10个属性值,分别是:Age(年龄)、性别(Sex)、Body mass index(体质指数)、Average Blood Pressure(平均血压)、S1~S6一年后疾病级数指标,Target为一年后患疾病的定量指标, 适用于回归任务。
讯享网from sklearn.datasets import load_diabetes diabetes = load_diabetes()
2.4 手写数字
共有1797个样本,每个样本有64的元素,对应到一个8x8像素点组成的矩阵,每一个值是其灰度值, target值是0-9,适用于分类任务。
from sklearn.datasets import load_digits X, y = load_digits(return_X_y=True) plt.imshow(X[0].reshape(8, 8), cmap='gray');# 下面完成灰度图的绘制 # 灰度显示图像 plt.axis('off')# 关闭坐标轴 print('The digit in the image is {}'.format(y[0])) # 格式化打印 The digit in the image is 0 
2.5 体能训练
兰纳胡德提供的体能训练数据,data和target都是20x3,data的特征包括Chins, Situps and Jumps.(引体向上 仰卧起坐 跳跃),target的三维分别是Weight, Waist and Pulse。(体重 腰围 脉搏),适用于多元回归问题,用的少。
讯享网from sklearn.datasets import load_linnerud data, target = load_linnerud(return_X_y=True) print(data.shape) # (20, 3) print(target.shape) # (20, 3)
2.6 红酒
共178个样本,代表了红酒的三个档次(分别有59,71,48个样本),以及与之对应的13维的属性数据,适用于分类任务。
from sklearn.datasets import load_wine wine = load_wine() 2.7 威斯康辛州乳腺癌
包含了威斯康辛州记录的569个病人的乳腺癌恶性/良性(1/0)类别型数据,以及与之对应的30个维度的生理指标数据,适用于二分类问题。

讯享网from sklearn.datasets import load_breast_cancer cancer = load_breast_cancer()
数据集的详细介绍可以阅读:Toy datasets
3 真实世界中的数据集
| 调用 | 描述 |
|---|---|
fetch_olivetti_faces() |
Olivetti 脸部图片数据集 |
fetch_20newsgroups() |
用于文本分类、文本挖据和信息检索研究的国际标准数据集之一。数据集收集了大约20,000左右的新闻组文档,均匀分为20个不同主题的新闻组集合。返回一个可以被文本特征提取器 |
fetch_20newsgroups_vectorized() |
这是上面这个文本数据的向量化后的数据,返回一个已提取特征的文本序列,即不需要使用特征提取器 |
fetch_lfw_people() |
打好标签的人脸数据集 |
fetch_lfw_pairs() |
该任务称为人脸验证:给定一对两张图片,二分类器必须预测这两个图片是否来自同一个人 |
fetch_covtype() |
森林植被类型,总计个样本,每个样本由54个维度表示(12个属性,其中2个分别是onehot4维和onehot40维),以及target表示植被类型1-7,所有属性值均为number,详情可调用fetch_covtype()['DESCR']了解每个属性的具体含义 |
fetch_rcv1() |
路透社新闻语料数据集 |
fetch_kddcup99() |
KDD竞赛在1999年举行时采用的数据集,KDD99数据集仍然是网络入侵检测领域的事实Benckmark,为基于计算智能的网络入侵检测研究奠定基础,包含41项特征 |
fetch_california_housing() |
加利福尼亚的房价数据,总计20640个样本,每个样本8个属性表示,以及房价作为target,所有属性值均为number,详情可调用fetch_california_housing()['DESCR']了解每个属性的具体含义; |
fetch_species_distributions() |
物种分布数据集 |
下面以sklearn.datasets.fetch_20newsgroups为例,加载数据集其参数有:
- subset: ‘train’或者’test’,‘all’,可选,选择要加载的数据集:训练集的“训练”,测试集的“测试”,两者的“全部”
- data_home: 可选,默认值:无。指定数据集的下载路径。如果没有,所有scikit学习数据都存储在
〜/scikit_learn_data子文件夹中 - categories: 选取哪一类数据集[类别列表],默认20类
- shuffle: 是否对数据进行随机排序
- random_state: numpy随机数生成器或种子整数
- download_if_missing: 可选,默认为True,如果没有下载过,重新下载
- remove: (‘headers’,‘footers’,‘quotes’)删除部分文本
from sklearn.datasets import fetch_20newsgroups data_test = fetch_20newsgroups(subset='test', shuffle=True, random_state=42) data_train = fetch_20newsgroups(subset='train', shuffle=True, random_state=42) print(dir(data_train)) # print(data_train.DESCR) # print(data_test.data[0]) #测试集中的第一篇文档 print('训练集数据分类名称:{}'.format(data_train.target_names)) print(data_test.target[:10]) print('训练集数据:{} 条'.format(data_train.target.shape)) print('测试集数据:{} 条'.format(data_test.target.shape)) [‘DESCR’, ‘data’, ‘filenames’, ‘target’, ‘target_names’]
训练集数据分类名称:[‘alt.atheism’, ‘comp.graphics’, ‘comp.os.ms-windows.misc’, ‘comp.sys.ibm.pc.hardware’, ‘comp.sys.mac.hardware’, ‘comp.windows.x’, ‘misc.forsale’, ‘rec.autos’, ‘rec.motorcycles’, ‘rec.sport.baseball’, ‘rec.sport.hockey’, ‘sci.crypt’, ‘sci.electronics’, ‘sci.med’, ‘sci.space’, ‘soc.religion.christian’, ‘talk.politics.guns’, ‘talk.politics.mideast’, ‘talk.politics.misc’, ‘talk.religion.misc’]
[ 7 5 0 17 19 13 15 15 5 1]
训练集数据:(11314,) 条
测试集数据:(7532,) 条
sklearn.datasets.fetch_20newsgroups_vectorized加载20个新闻组数据集并将其转换为tf-idf向量,这是一个方便的功能; 使用sklearn.feature_ extraction.text.Vectorizer的默认设置完成tf-idf 转换。
讯享网from sklearn.datasets import fetch_20newsgroups_vectorized from sklearn.utils import shuffle from sklearn.model_selection import train_test_split bunch = fetch_20newsgroups_vectorized(subset='all') X, y = shuffle(bunch.data, bunch.target) print(X.shape) # (18846, ) # 数据集划分为训练集0.7和测试集0.3 X_train, X_test, y_train, y_test = train_test_split(X, y, test_size=0.3) print(X_train.shape) # (13192, ) print(X_test.shape) # (5654, )
数据集的详细介绍可以阅读:Real world datasets
4 生成数据和生成分类数据
4.1 分类
sklearn.datasets.make_classification(n_samples=100, n_features=20, n_informative=2, n_redundant=2, n_repeated=0, n_classes=2, n_clusters_per_class=2, weights=None, flip_y=0.01, class_sep=1.0, hypercube=True,shift=0.0, scale=1.0, shuffle=True, random_state=None) 通常用于分类算法。
- n_features :特征个数= n_informative + n_redundant + n_repeated
- n_informative:多信息特征的个数
- n_redundant:冗余信息,informative特征的随机线性组合
- n_repeated :重复信息,随机提取n_informative和n_redundant 特征
- n_classes:分类类别
- n_clusters_per_class :某一个类别是由几个cluster构成的
示例:
讯享网from sklearn import datasets import matplotlib.pyplot as plt data,target = datasets.make_classification(n_samples=100,n_features=2, n_informative=2,n_redundant=0,n_repeated=0, n_classes=2,n_clusters_per_class=1) print(data.shape) # (100, 2) print(target.shape) # (100,) plt.scatter(data[:,0],data[:,1],c=target) plt.show()

4.2 其它生成分类样本的函数
make_blobs函数会根据用户指定的特征数量、中心点数量、范围等来生成几类数据,这些数据可用于测试聚类算法的效果。其中:
- n_samples是待生成的样本的总数。
- n_features是每个样本的特征数。
- centers表示类别数。
- cluster_std表示每个类别的方差,例如我们希望生成2类数据,
其中一类比另一类具有更大的方差,可以将cluster_std设置为[1.0,3.0]。
示例:
import matplotlib.pyplot as plt from sklearn.datasets import make_classification from sklearn.datasets import make_blobs from sklearn.datasets import make_gaussian_quantiles from sklearn.datasets import make_hastie_10_2 plt.figure(figsize=(10,10)) # 创建一个10 * 10 英寸的图像 plt.subplots_adjust(bottom=.05,top=.9,left=.05,right=.95) plt.subplot(421) plt.title("One informative feature, one cluster per class",fontsize='small') X1,Y1= make_classification(n_samples=1000,n_features=2,n_redundant=0,n_informative=1,n_clusters_per_class=1) plt.scatter(X1[:,0],X1[:,1],marker='o',c=Y1) plt.subplot(422) plt.title("Two informative features, one cluster per class", fontsize='small') X2,Y2 = make_classification(n_samples=1000,n_features=2,n_redundant=0,n_informative=2) plt.scatter(X2[:,0],X2[:,1],marker='o',c=Y2) plt.subplot(423) plt.title("Two informative features, two clusters per class", fontsize='small') X2,Y2 = make_classification(n_samples=1000,n_features=2,n_redundant=0,n_informative=2) plt.scatter(X2[:,0],X2[:,1],marker='o',c=Y2) plt.subplot(424) plt.title("Multi-class, two informative features, one cluster",fontsize='small') X1,Y1= make_classification(n_samples=1000,n_features=2,n_redundant=0,n_informative=2,n_clusters_per_class=1,n_classes=3) plt.scatter(X1[:,0],X1[:,1],marker='o',c=Y1) plt.subplot(425) plt.title("Three blobs", fontsize='small') # 1000个样本,2个属性,3种类别,方差分别为1.0,3.0,2.0 X1,Y1 = make_blobs(n_samples=1000,n_features=2,centers=3,cluster_std=[1.0,3.0,2.0]) plt.scatter(X1[:,0],X1[:,1],marker='o',c=Y1) plt.subplot(426) plt.title("Gaussian divided into four quantiles", fontsize='small') # make_gaussian_quantiles函数利用高斯分位点区分不同数据 X1,Y1 = make_gaussian_quantiles(n_samples=1000,n_features=2,n_classes=4) plt.scatter(X1[:,0],X1[:,1],marker='o',c=Y1) # make_hastie_10_2函数利用Hastie算法,生成2分类数据 plt.subplot(427) plt.title("hastie data ", fontsize='small') X1,Y1 = make_hastie_10_2(n_samples=1000) # plt.scatter(X1[:,0],X1[:,1],marker='o',c=Y1) plt.show() 
4.3 自定义生成圆形和月牙形分类数据
- 生成环形,factor :外圈与内圈的尺度因子<1
讯享网sklearn.datasets.make_circles(n_samples=100, shuffle=True, noise=None, random_state=None, factor=0.8)
- 生成半环形
sklearn.datasets.make_moons(n_samples=100, shuffle=True, noise=None, random_state=None) 示例:
讯享网from sklearn.datasets import make_circles from sklearn.datasets import make_moons import matplotlib.pyplot as plt fig = plt.figure(1) x1,y1 = make_circles(n_samples=1000,factor=0.5,noise=0.1) plt.subplot(121) plt.title('make_circles function example') plt.scatter(x1[:,0],x1[:,1],marker='o',c=y1) plt.subplot(122) x1,y1 = make_moons(n_samples=1000,noise=0.1) plt.title('make_moons function example') plt.scatter(x1[:,0],x1[:,1],marker='o',c=y1) plt.show()

数据集的详细介绍可以阅读:Generated datasets
5 其他
5.1 样本图片
scikit 在通过图片的作者共同授权下嵌入了几个样本 JPEG 图片。这些图像为了方便用户对 test algorithms (测试算法)和 pipeline on 2D data (二维数据管道)进行测试,用datasets.load_sample_image()加载。
from sklearn.datasets import load_sample_image import matplotlib.pyplot as plt img = load_sample_image('china.jpg') print(img.shape) # (427, 640, 3) print(img.dtype) # uint8 plt.imshow(img) plt.show() 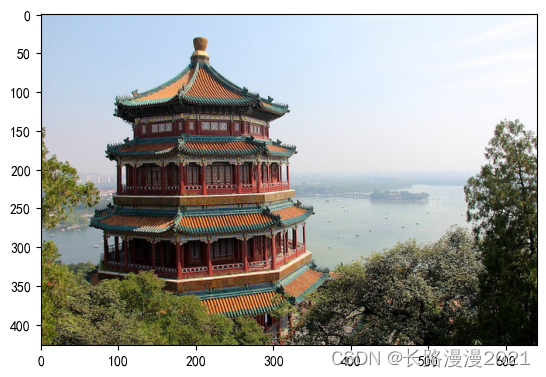
5.2 svmlight或libsvm格式的数据
讯享网# 可以加载svmlight / libsvm格式的数据集。 from sklearn.datasets import load_svmlight_file,load_svmlight_files # 加载单个文件 X_train, y_train = load_svmlight_file("/path/to/train_dataset.txt") # 加载多个文件 X_train, y_train, X_test, y_test = load_svmlight_files(("/path/to/train_dataset.txt", "/path/to/test_dataset.txt"))
svmlight / libsvm格式的公共数据集——https://www.csie.ntu.edu.tw/~cjlin/libsvmtools/datasets
5.3 从http://openml.org下载的数据
openml.org是一个用于机器学习数据和实验的公共存储库,它允许每个人上传开放的数据集,可以通过sklearn.datasets.fetch_openml()函数来从openml.org下载数据集。
例如,下载gene expressions in mice brains(老鼠大脑中的基因表达)数据集:
from sklearn.datasets import fetch_openml mice = fetch_openml(name='miceprotein', version=4) print(mice.DESCR) # 查看详情 5.4 从外部加载的数据
建议除了玩具数据集和生成数据集以外,都在网上下载后用pandas导入。
- kaggle:https://www.kaggle.com
- 天池:https://tianchi.aliyun.com/dataset
- 飞桨:https://aistudio.baidu.com/aistudio/datasetoverview
- 讯飞:http://challenge.xfyun.cn/
- 搜狗实验室:http://www.sogou.com/labs/resource/list_pingce.php
- DC竞赛:https://www.pkbigdata.com/common/cmptIndex.html
- DF竞赛:https://www.datafountain.cn/dataset
- Google数据集:https://toolbox.google.com/datasetsearch
- 微软数据集:https://msropendata.com/
- 科赛网:https://www.kesci.com/home/dataset
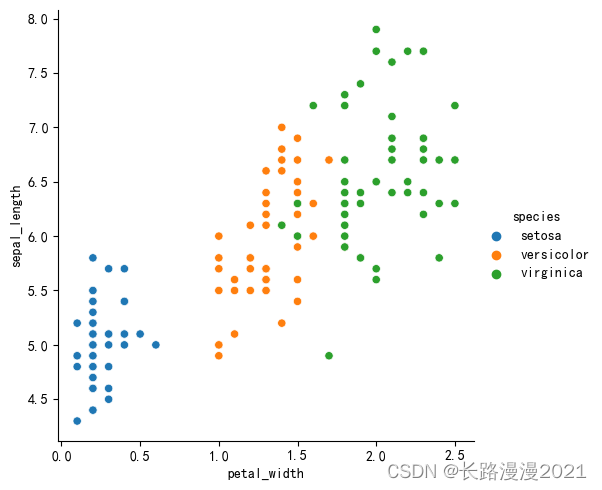
例如,导入iris文件:
讯享网import pandas as pd import seaborn as sns # 基于matplotlib和pandas的画图库 import matplotlib.pyplot as plt data = pd.read_csv("H:\\machine-learning\\Code\\seaborn-data-master\\seaborn-data-master\\iris.csv", encoding='gbk') # 我把数据集列名改成了中文 所以用gbk解码 sns.relplot(x='petal_width', y='sepal_length', hue="species", data=data) # seaborn库这里不做过多介绍 plt.rcParams['font.sans-serif'] = ['SimHei'] # 步骤一(替换sans-serif字体) # plt.rcParams['axes.unicode_minus'] = False # 步骤二(解决坐标轴负数的负号显示问题) plt.show()
sklearn的数据集datasets库中,我们一般使用玩具数据集和样本生成器比较多,其他数据建议外部导入。
数据集的详细介绍可以阅读:Loading other datasets
补充:
- COCO是一个可用于object detection, segmentation and caption的大型数据集。
- ImageNet——图像总数约1,500,000; 每个都有多个边界框和相应的类标签。大小:约150GB
- Yelp Reviews——由数百万用户评论、商业类型和来自多个大型城市的超过20万张照片组成。这在全球都是一个常用的NLP挑战级数据集。大小:2.66 GB JSON,2.9 GB SQL and 7.5 GB Photos(全部已压缩);数量:5,200,000条评论,174,000条商业类型,20万张图片和11个大型城市
参考
- sklearn库中的标准数据集与基本功能:https://www.cnblogs.com/python-machine/p/6940578.html
- Dataset loading utilities:https://scikit-learn.org/stable/datasets.html
- sklearn中的datasets数据集:https://zhuanlan.zhihu.com/p/
- 机器学习之sklearn生成数据和生成分类数据:https://blog.csdn.net/wangdong2017/article/details/
版权声明:本文内容由互联网用户自发贡献,该文观点仅代表作者本人。本站仅提供信息存储空间服务,不拥有所有权,不承担相关法律责任。如发现本站有涉嫌侵权/违法违规的内容,请联系我们,一经查实,本站将立刻删除。
如需转载请保留出处:https://51itzy.com/kjqy/126253.html