
函数:ContourPlot
示例代码
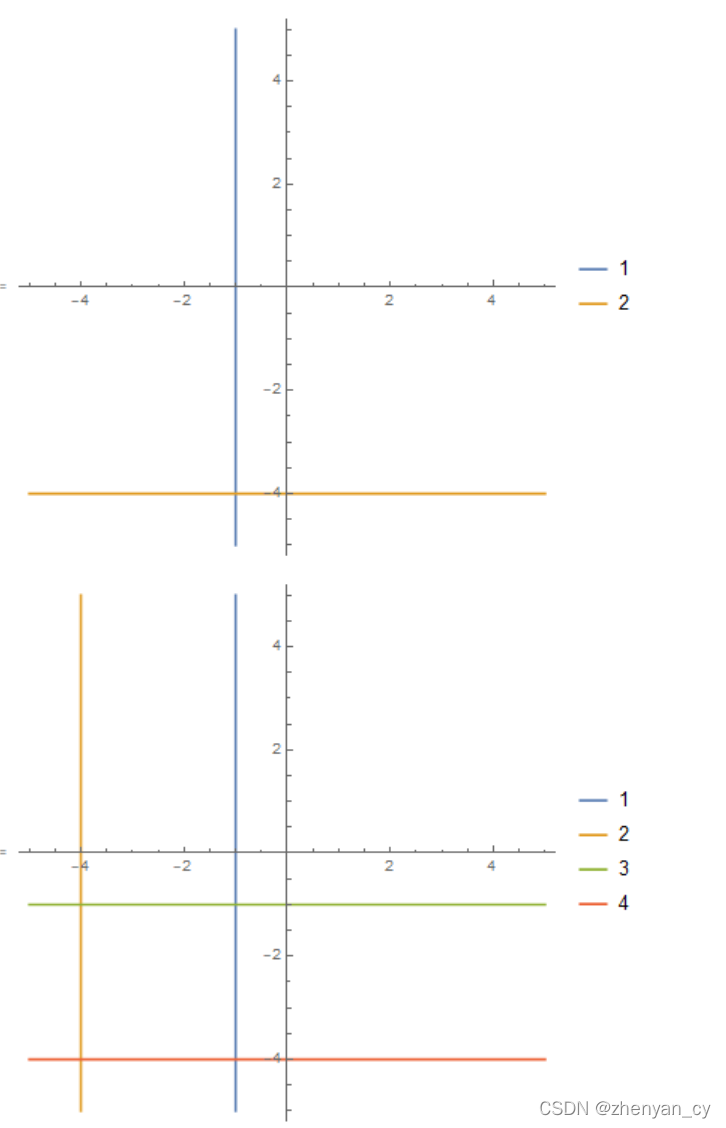
Clear["`*"]; a = 1; c = -2; ContourPlot[{x == a + c, y == 2*a + 3*c}, {x, -5, 5}, {y, -5, 5}, Axes -> True, Frame -> False, PlotLegends -> {"1", "2"}] ContourPlot[{x == a + c, x == 2*a + 3*c, y == a + c, y == 2*a + 3*c}, {x, -5, 5}, {y, -5, 5}, Axes -> True, Frame -> False, PlotLegends -> {"1", "2", "3", "4"}]讯享网
示例结果

版权声明:本文内容由互联网用户自发贡献,该文观点仅代表作者本人。本站仅提供信息存储空间服务,不拥有所有权,不承担相关法律责任。如发现本站有涉嫌侵权/违法违规的内容,请联系我们,一经查实,本站将立刻删除。
如需转载请保留出处:https://51itzy.com/kjqy/109453.html